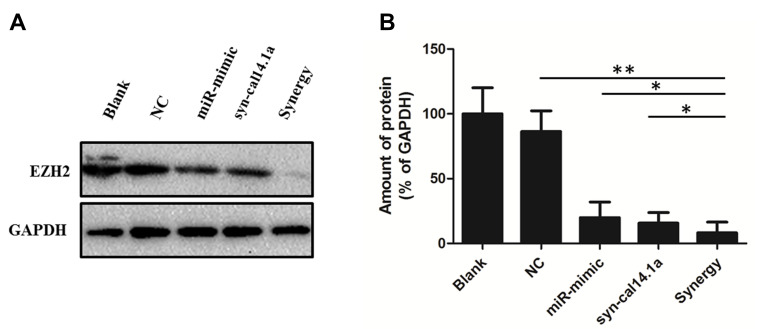
Figure 3.
Attenuation of EZH2 in breast cancer SK-BR-3 cells in response to different treatment. (A) EZHE2 was analyzed by Western Blot with GAPDH as a loading control. (B) Each band was quantified, and the signal was reported to the corresponding level of GAPDH. *P<0.05, **P<0.001. Blank: Treated by PBS; NC: Treated by mimic-NC miRNA and negative control peptide; miR-mimic: Treated by miR-101-3p mimic miRNA; syn-cal14.1a: Treated by syn-cal14.1a peptide; synergy: Treated by miR-101-3p mimic miRNA and syn-cal14.1a peptide.

