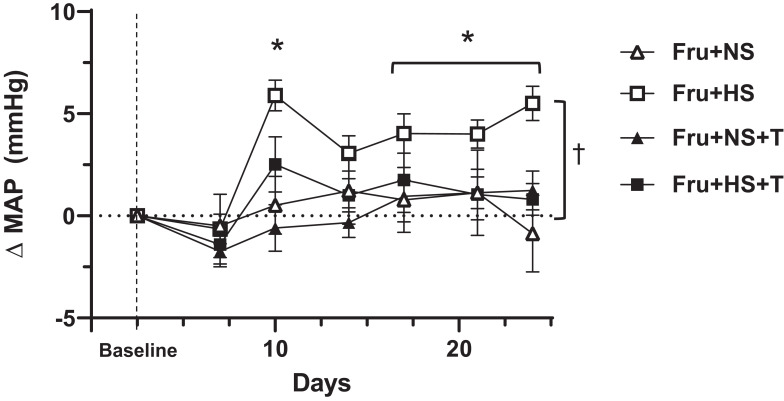
Figure 1.
Change in mean arterial pressure (MAP) over the 3-week period for the fructose-fed groups. Baseline MAP and delta MAP for glucose-fed groups did not change significantly over time (Table 2); not depicted graphically for simplicity. Fru+NS, 20% fructose+0.4% NaCl; Fru+HS, 20% fructose+4% NaCl; +T, indicates addition of 15 mg/400g BW Tempol; BW, body weight. *Values are mean ± SE; n as in Table 2. *P < 0.05 vs baseline for Fru+HS; †P < 0.05 for Fru+HS vs all other fructose-fed groups by two-way ANOVA on Day 24.

