Fig. 1.
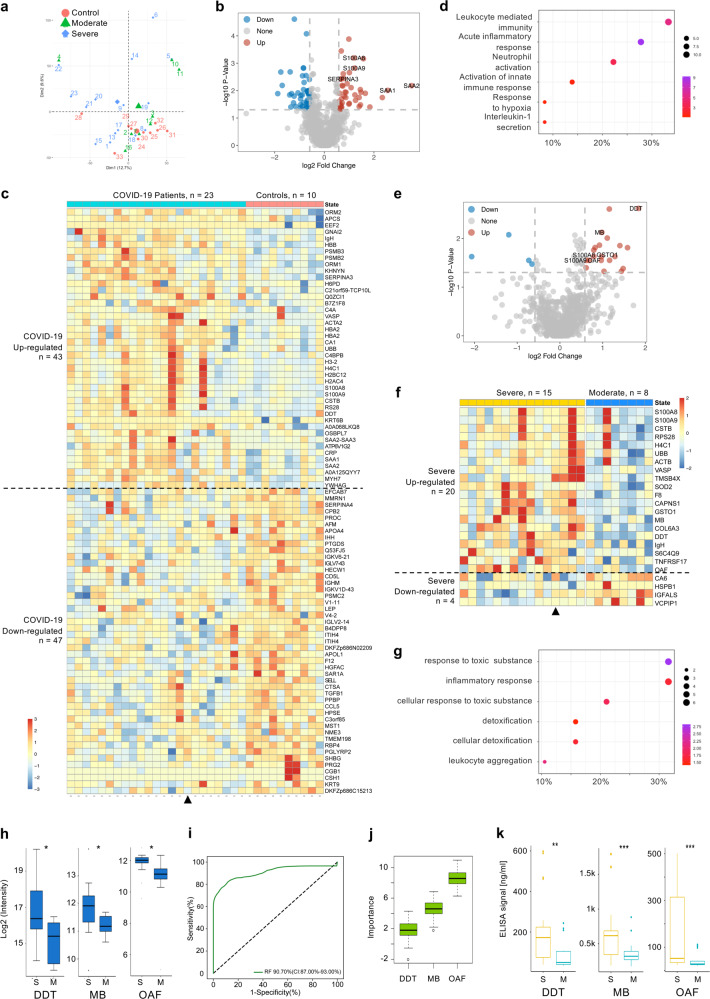
Identification of proteomic predictive factors for severe COVID-19 patient screening. Sera samples from two independent cohorts were collected. Samples from Development group were proteomically analyzed by LC-MS/MS and PRM. Machine-learning analysis of the proteomics data identified three predictive factors for screening severe COVID-19 patients. Samples from Validation group were analyzed by ELISA assay to validate the proteomic predictive factors. a PCA plot of the proteomics data (988 quantified proteins), red, green and blue data points are control, moderate and severe COVID-19 patients, respectively. The subject ID numbers are also shown. The centroid of each sample group is indicated by a larger solid red circle, green triangle and blue diamond, respectively. b Volcano plot showing DE protein identification between all patients (Development group) and controls. Selected DE proteins are indicated. c Heatmap visualization of the 90 significantly DE proteins between patients and controls. Upregulated and downregulated are in respect to patients vs. controls. Triangle indicates the only patient (Patient 22) who was classified as severe on hospital admission. Gene names are shown on the right. d Dotplot visualization of selected GO biological process terms for the upregulated proteins in COVID-19 patients. Dot sizes are proportional to the number of proteins annotated to the corresponding GO term. Color-scale is proportional to −log10(adjusted P value). e Volcano plot showing DE protein identification between all severe and moderate patients in Development group, with selected DE proteins indicated. f Heatmap visualization of the 24 significantly DE proteins between severe and moderate patients. Upregulated and downregulated are in respect to severe vs. moderate. Triangle indicates the only patient who was classified as severe on hospital admission. Gene names are shown on the right. g Dotplot visualization of selected GO biological process terms for the upregulated proteins in severe patients. Dot sizes are proportional to the number of proteins annotated to the corresponding GO term. Color-scale is proportional to −log10(adjusted P value). h Boxplots of PRM validation intensity of DDT, OAF, and MB in severe and moderate patients. i ROC of the random forest model built with the three protein features shown in j. The AUC is quoted with the 95% confidence interval values in brackets. j Importance ranking of OAF, MB and DDT in random forest models. k Boxplots of ELISA detection values of DDT, MB, and OAF between moderate (n = 21) and severe (n = 29) COVID-19 patients in Validation group. *P < 0.05. P values were calculated by Wilcoxon Rank Sum test. S Severe, M Moderate

