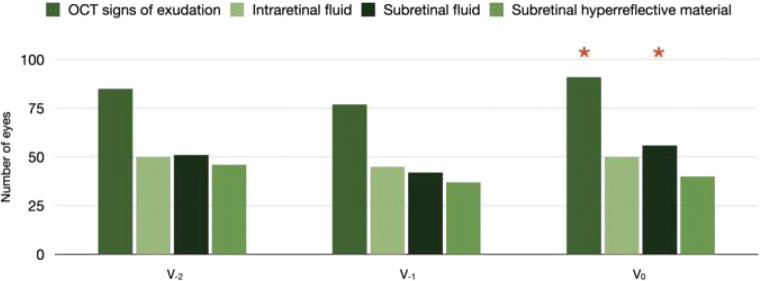
Fig. 3.
Bar chart showing differences in OCT findings between visits. Bar chart displaying study cohort’s structural OCT findings at different visits. The height of the bars corresponds to the number of eyes with the corresponding OCT finding graded. The number of patients with OCT sings of exudation and subretinal fluid at the inclusion (V0) visit was significantly higher as compared with the immediately preceding (V−1) visit. Conversely, no differences were detected in terms of OCT findings between the V−1 and V−2 visits. Red asterisks indicate significative differences in the comparison with the previous visit

