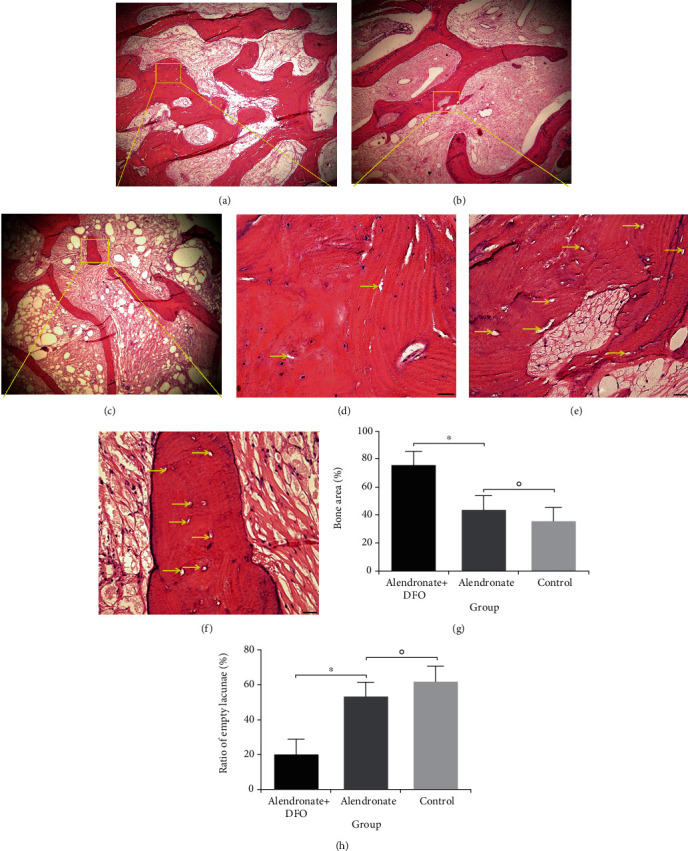
Figure 2.

HE staining shows the trabecular structure and osteocyte lacunae of the femoral head ((a–c) scale bar = 200 μm; (d–f) scale bar = 50 μm). Yellow arrow indicated the osteocyte lacunae. (a, d) Alendronate and DFO group. (b, e) Alendronate group. (c, f) Control group or placebo group. (g) Semiquantitative outcomes of bone trabecular area. (h) Quantitative outcomes of the osteocyte lacunae ratio. ∗ indicated significant difference between the two groups (p < 0.05). ○ indicated the difference between the two groups without statistical significance (p > 0.05).
