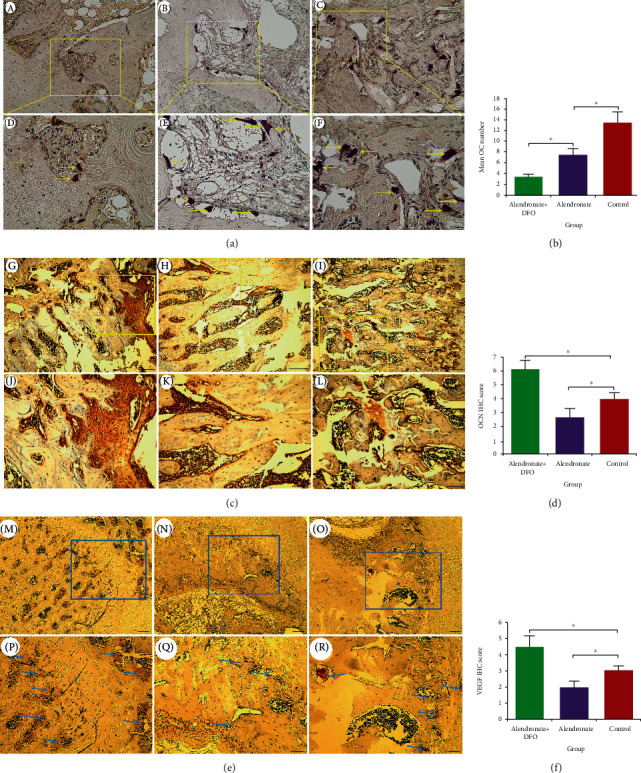
Figure 3.

TRAP staining for osteoclasts (a, (A–C) scale bar = 200 μm; (D–F) scale bar = 50 μm). Immunohistochemical outcomes of osteocalcin ((c) (G–I) scale bar = 200 μm; (J–L) scale bar = 50 μm) and VEGF ((e) (M–O) scale bar = 200 μm; (P–R) scale bar = 50 μm) expressions. (b) Quantitative outcomes of OCs number. (d) Semiquantitative outcomes of OCN scores. (f) Semiquantitative outcomes of VEGF scores. ∗ indicated significant difference between the two groups (p < 0.05).
