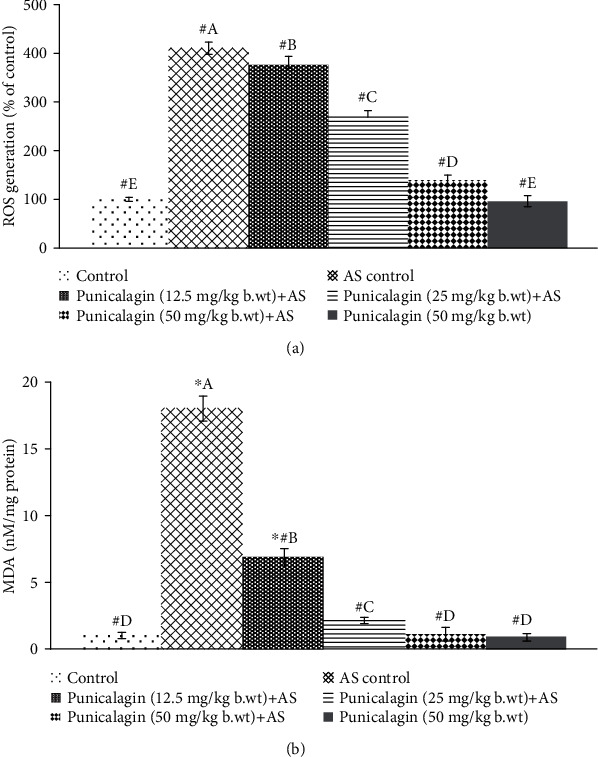
Figure 3.

Punicalagin reduced ROS generation following AS induction (a) and MDA levels (b). The results are presented as the mean ± SD (n = 6). ∗ represents p < 0.05 vs. normal control; # represents p < 0.05 vs. AS control. A–E represent the mean values from the experimental groups that differ at p < 0.05.
