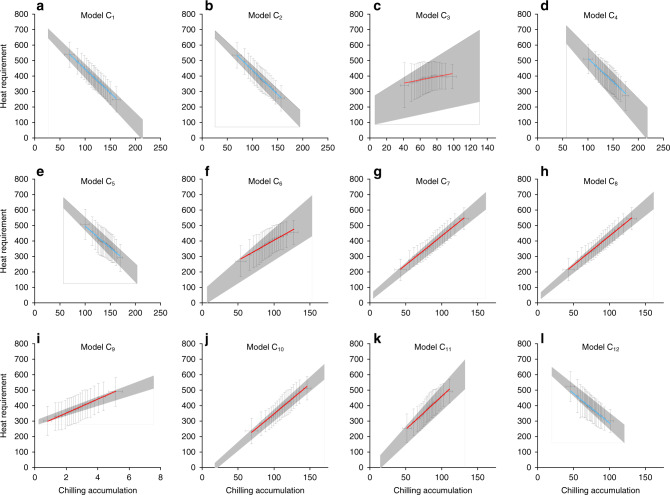
Fig. 3. Relationship between CA and HR for leaf-out of Betula pendula.
Chilling accumulation (CA) from the previous 1 November to the leaf-out date was calculated using the 12 chilling models. Heat requirement (HR) was an integration of daily mean temperatures >0 °C from 1 January to the leaf-out date. a–l Models C1–C12. Data are divided into 20 groups with the same number of records. Error bars, mean values ± SD of HR or CA within each group (n = 6301 records). The linear regression lines (blue for negative correlations and red for positive correlations) are shown for each model. The shaded area shows the uncertainties, which were estimated by using the 95% confidence interval for slope and interception of regression lines.

