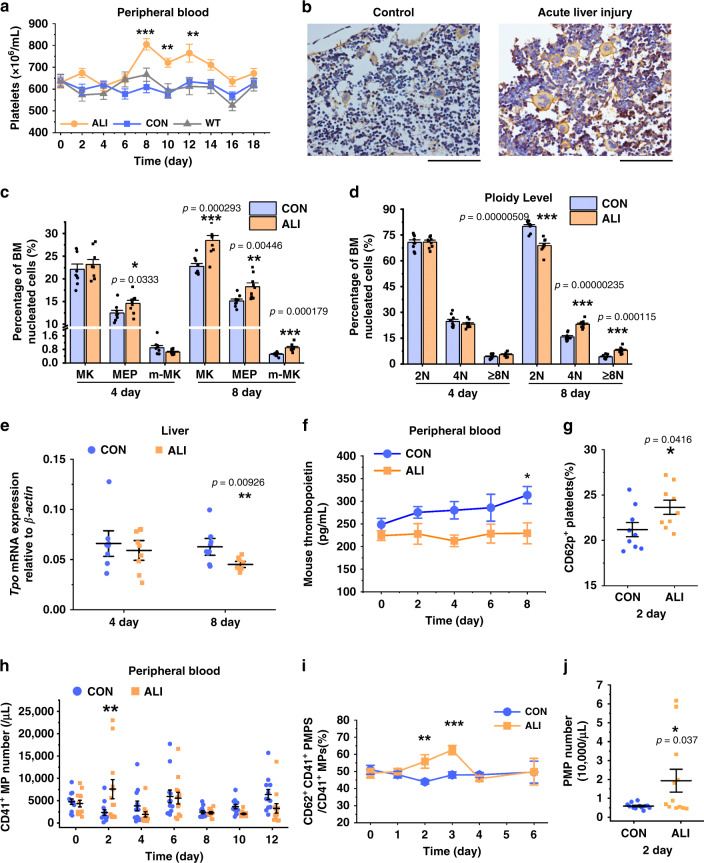
Fig. 1. Thrombocytosis during ALI was positively correlated with the elevation of PMPs.
a During CCl4-induced acute liver injury (ALI), thrombocytosis was detected as an increased peripheral blood (PB) platelet counts in the ALI vs. control (CON) mice (n = 12 mice, two-way repeated-measures ANOVA with Bonferroni’s multiple comparison tests, p = 0.0045 (Con as control)). Non-treated mice (WT) were set as baseline control. b, c Megakaryocytopoiesis in bone marrow (BM) after CCl4 injection is shown. On day 8 after injection, representative femur sections stained with CD41 and hematoxylin showed increased levels of CD41-positive cells (Scale bars: 100 μm) (b), and a histogram indicated that BM whole megakaryocytic cells (MK, CD41 positive), including mature megakaryocytes (m-MK, CD41, and CD42 double-positive) and megakaryocyte-erythroid progenitors (MEP, CD41, and CD71 double positive), were increased in the ALI mice c. Representative FCM plots are shown in Supplementary Fig. 1g. d The percentage of cells of each ploidy in BM is shown. e, f Liver TPO synthesis was suppressed under ALI, as demonstrated by liver cell qPCR (e) and plasma TPO ELISA analyses (two-way repeated measures ANOVA with Bonferroni’s multiple comparison tests, p = 0.0085) (f). g PB-PLTs incorporated increased levels of CD62p-positive activated PLT in the ALI mice on day 2 after injection. h–j Platelet-derived microparticles (PMPs) increased in the ALI mice (n = 12 mice). Compared with those of the control group, the circulating CD41+ microparticles (MPs) increased (two-way repeated-measures ANOVA with Bonferroni’s multiple comparison tests) (h), and the proportion of CD41+/CD62p+ PMPs among the CD41+ MPs in PB increased as well (two-way repeated-measures ANOVA with Bonferroni’s multiple comparison tests, p = 0.0109) (i). The absolute count of PMPs on day 2 after CCl4 injection was higher than that in the control group when platelets started to increase mice) (j). Each time point in each animal cohort represents a mean ± S.E.M. of nine mice and two-tailed unpaired t-tests were used unless otherwise specified. Source data are provided as a Source Data file *P < 0.05, **P < 0.01, ***P < 0.001.

