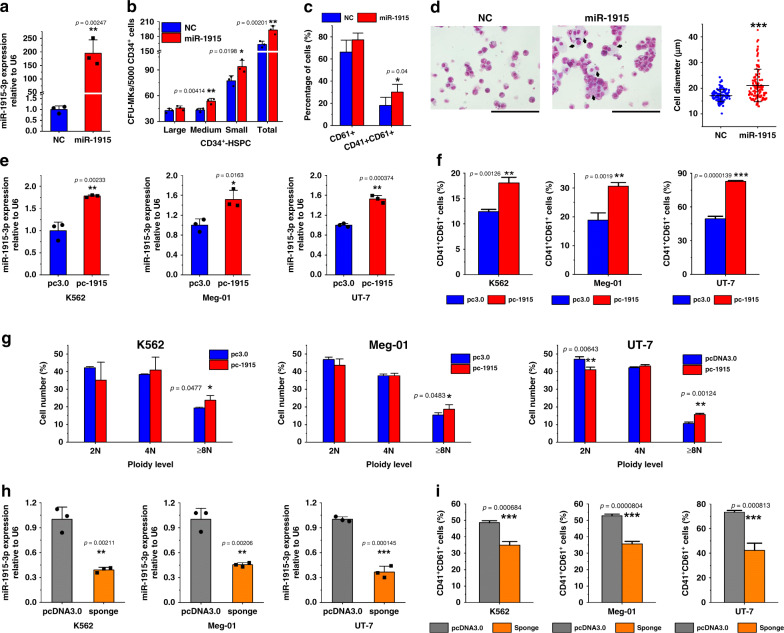
Fig. 4. Alteration of the miR-1915-3p expression affected MK differentiation and maturation.
a qPCR confirmed the overexpression of miR-1915-3p in CD34+-HSPCs after miRNA mimics (miR-1915) were transfected for 24 h compared with the negative control (NC). U6 was set as the normalized control (n = 3 donors). b, c Overexpression of miR-1915-3p promoted the CFU-MKs from the CD34+-HSPCs (n = 3 donors, paired-samples t-tests) b and increased the expression of the MK integrins CD41 and CD61 on day 15. (mean ± S.E.M. of n = 5 donors, paired-samples t-tests) (c). Representative FCM plots are shown in Supplementary Fig. 6c. d By megakaryocytic induction on day 20, Cytospin and Wright–Giemsa staining demonstrated more polyploid cells and larger cell dimensions (black arrows) with miR-1915-3p overexpression. Cells from five random views were measured. Statistical analysis and results were conducted on data from three biologically independent experimental replicates Unpaired t-tests with Welch’s correction were used for the statistical analysis. p < 0.0001. (Scale bars: 100 μm) e–g In the K562, Meg-01 and UT-7 cells, overexpression of miR-1915-3p by stable transfection with a plasmid vector carrying primary miR-1915-3p (n = 3 independent experiments) (e) promoted the CD41+/CD61+ populations (n = 3 independent experiments) (f) when cells were treated with a suboptimal amount of PMA for 3 days. Representative FCM plots are shown in Supplementary Fig. 7a. Cell polyploidization was upregulated with overexpression as well. g The percentage of cells of each ploidy is shown. Representative FCM histograms are shown in Supplementary Fig. 7b (n = 3 independent experiments). h, i Suppression of miR-1915-3p expression with a miRNA sponge (n = 3 independent experiments) h significantly decreased the CD41+/CD61+ populations in the PMA-treated K562, UT-7 and Meg-01 cells i Representative FCM plots are shown in Supplementary Fig. 7d (n = 3 independent experiments). All data are shown as the mean ± S.D from two-tailed unpaired-samples t-tests. P-value unless otherwise specified. Source data are provided as a Source Data file *P < 0.05, **P < 0.01, ***P < 0.001.

