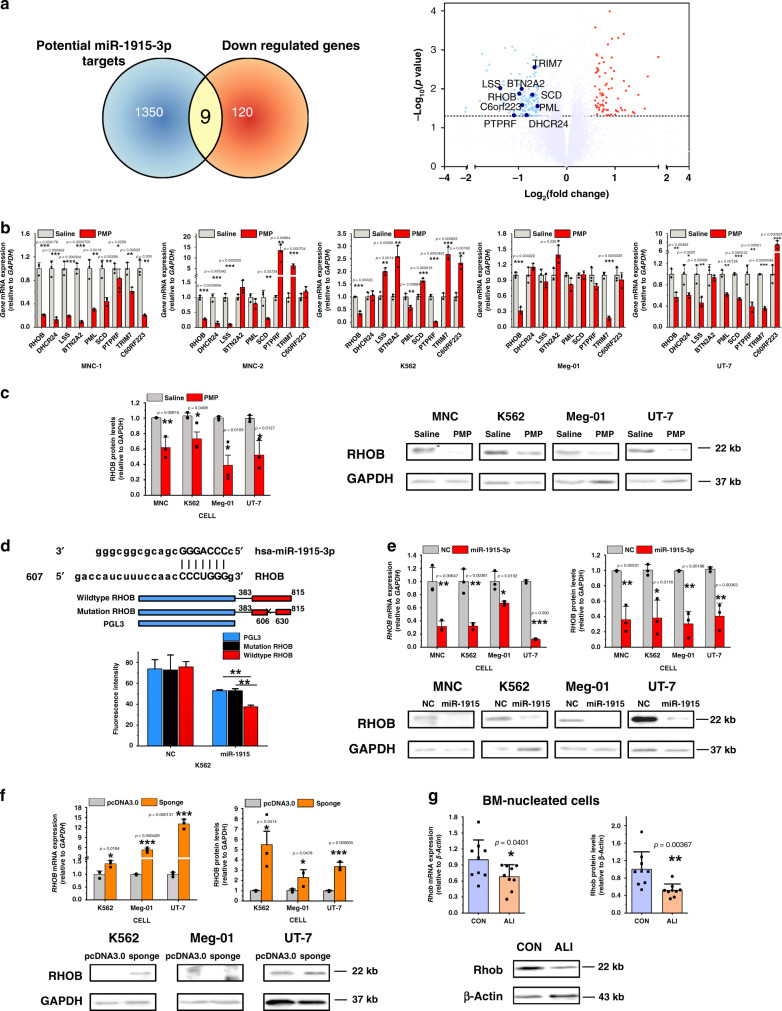
Fig. 5. RHOB is a direct target of miR-1915-3p and the mediator of PMP function.
a Differential expression of the potential target genes of PMPs and miR-1915-3p is shown. The selected 9 genes are shown in the bottom panel, which were downregulated consistently and significantly (<0.667-fold changes and p < 0.05) with PMP treatment in gene expression profiling analysis and potentially interacted with miR-1915-3p through bioinformatic analysis (Venn diagram, upper panel). b qPCR analysis of potential target gene expression in the MNC, UT-7, K562 and Meg-01 cells. RHOB was consistently downregulated in all cells detected (normalized to Saline, n = 3 independent experiments per condition). c Quantification of the RHOB protein levels by Western blotting analysis (normalized to Saline, n = 3 independent experiments per condition). Lower panel: Representative Western blotting images of RHOB expression. RHOB was suppressed with PMP treatment. d Upper, putative miR-1915-3p binding sequence in the RHOB 3′-UTR. Middle, the scheme of the luciferase reporter vector with the wild-type miR-1915-3p recognition fragment from the RHOB 3′-UTR or mutant recognition site. miR-1915-3p overexpression decreased the luciferase activity of the reporter containing wild-type binding sequence of RHOB compared with that of the reporter containing the mutant form and the controls (n = 3 independent experiments, one-way ANOVA with Bonferroni’s multiple comparison test, p = 0.0009). e RHOB was downregulated in the K562, Meg-01, UT-7, and MNC cells transiently transfected with miR-1915-3p as evaluated by qPCR (left) and Western blots (right) (normalized to NC, n = 3 independent experiments per condition). f RHOB was upregulated in the K562, UT-7 and Meg-01 cells stably transfected with a miR-1915-3p sponge as evaluated by qPCR (left) and Western blots (right) (normalized to pcDNA3.0, n = 3 independent experiments per condition). g Rhob was downregulated in the ALI mouse BM nucleated cells as evaluated by qPCR (left) and Western blotting (right) (normalized to CON mouse, n = 9 mice). All data are expressed as the mean ± S.D, P-value. Two-tailed, unpaired Student’s t-tests were used unless otherwise specified. Source data are provided as a Source Data file *P < 0.05, **P < 0.01, ***P < 0.001.

