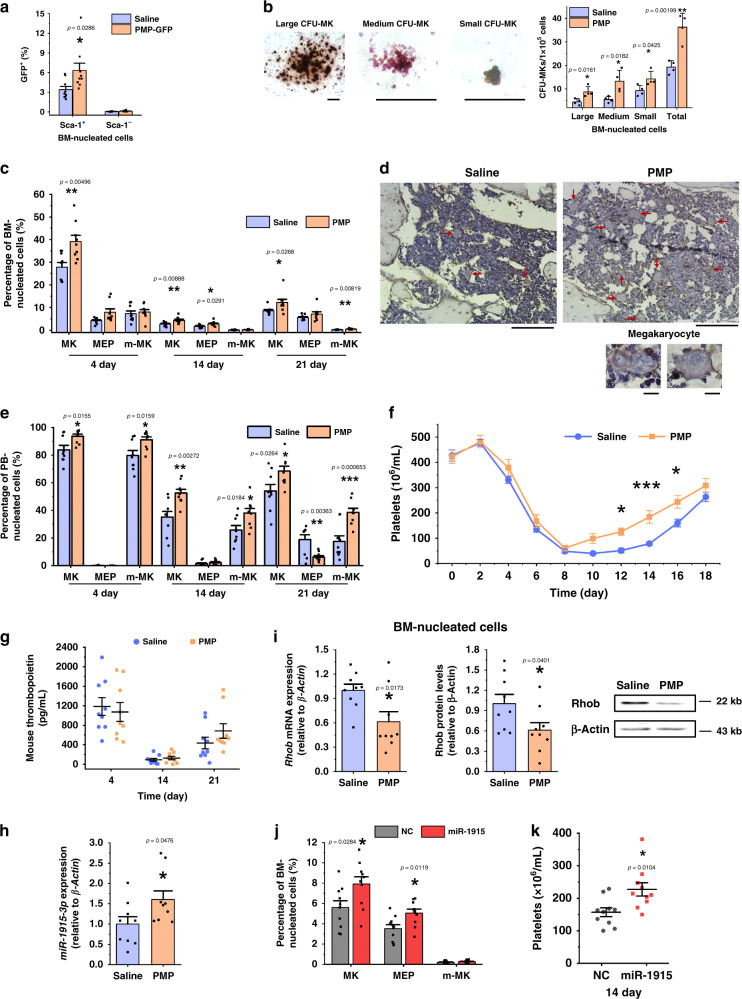
Fig. 6. Injection of exogenous PMPs stimulated MK differentiation and platelet production.
a PMPs from the GFP transgenic mice were isolated and transfused into the same strain of C57BL/6 mice. The percentage of GFP+ cells in the Sca-1-positive and Sca-1-negative nucleated cells was analyzed by FCM. b PMP treatment increased the CFU-MK formation of the BM nucleated cells. The mice were irradiated and injected with homologous PMPs or saline (control). Three days later, the BM was harvested for megakaryocytic colony-forming assays. The typical morphology of CFU-MK mouse colonies of different sizes is shown on the left (Scale bars: 100 μm). The statistical analysis is shown on the right. (n = 4 mice). c PMP enhanced the megakaryocytic lineage proportion of the BM nucleated cells. Representative FCM plots are shown in Supplementary Fig. 9c. d The femur sections stained with hematoxylin and a CD41 antibody indicate more polyploid and CD41+ cells with PMP injection. The tissue samples were harvested 21 days post injection, and the red arrows indicate large, polyploid and CD41-positive megakaryocytes (Scale bars: 100 μm). Representative fields of megakaryocytes in the BM are shown on the left (Scale bars: 10 μm). e PMPs enhanced the megakaryocytic lineage proportion of the PB nucleated cells. Representative FCM plots are shown in Supplementary Fig. 9d. f PMPs improved platelet recovery as indicated by the platelet count (n = 12 mice, two-way repeated-measures ANOVA with Bonferroni’s multiple comparison tests, p = 0.0171). g Plasma TPO was unaffected after PMP treatment. h qPCR indicated that miR-1915-3p was upregulated in the BM nucleated cells 2 days after PMP injection. i Rhob was downregulated in the mouse BM nucleated cells after PMP injection as evaluated by qPCR (left) and Western blotting (right) (normalized to the mouse after saline injection). Transfusion of PMPs overexpressing miR-1915-3p enhanced the megakaryocytic lineage proportion of the BM nucleated cells j and the platelet count in the PB k (n = 10 mice). Each time point in each animal cohort represents a mean ± SE.M. of 9 mice, P-value. Two-tailed, unpaired Student’s t-tests were used unless otherwise specified. Source data are provided as a Source Data file *P < 0.05, **P < 0.01, ***P < 0.001.

