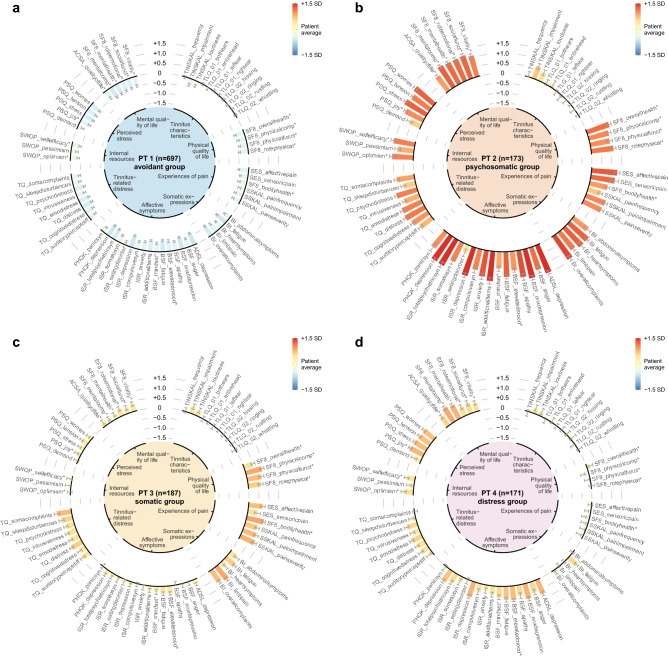
Figure 1.
Radial barcharts visualizing the 4 phenotypes. (a) Phenotype 1 (PT1) characterises the patient subgroup with lowest health burden among all phenotypes. (b) PT2 represents the most suffering subgroup, with all of the psychosomatic and somatic measurement averages exceeding the population mean 0.5 standard deviations (SD). PT3 (c) exhibits above population average scores for somatic indicators whereas PT4 (d) is characterised by increased distress scores, including subjective stress and perceived quality of life. Bars are arranged in a circular layout. The height of a bar shows a feature’s z-score normalised within-cluster average, and the grey line centred at the top of the bar illustrates the 95% confidence interval. The colour of a bar represents the difference of the within-cluster average from the overall patient average (PA), from − 1.5 SD below PA (dark blue) to PA (yellow) and 1.5 SD above PA (bright red). Features were grouped into 9 categories defined by tinnitus experts. The categories are shown within the inner circle. See subsection Features for a description of each questionnaire and the extracted features.

