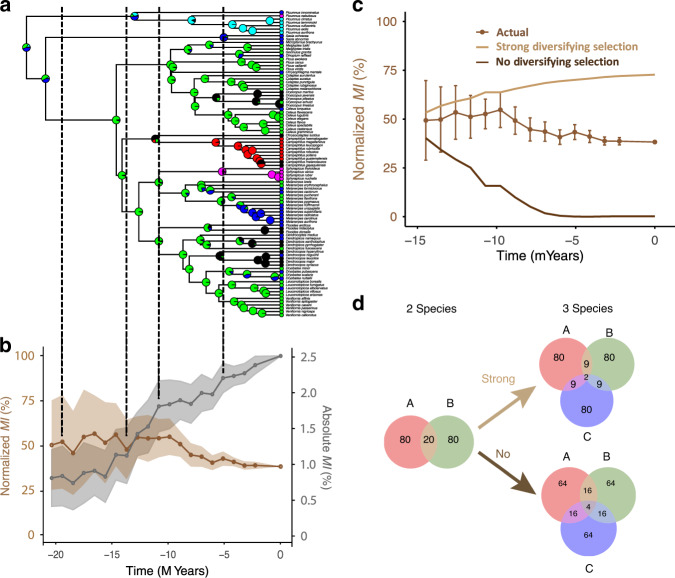
Fig. 3. Evolution of drumming: acoustic structure and information.
a Ancestral state reconstruction of drumming types along the woodpeckers’ phylogenetic tree. Pie charts at nodes represent the probability distribution of existing (colour-coded as in Fig. 2a) drumming types. b simulated information content associated with reconstructed drumming types; normalized overall mutual information (MI; brown curve) is scaled on the left y axis, while absolute MI (grey curve) is scaled on the right y axis—see ‘Methods’ for details. Shaded error bars show ±1 SD of mean information values obtained in simulations. c Ancestral normalized MI (as in b) compared to two modelled calculations corresponding to strong (light brown) and no (dark brown) selection pressure for species identity—models included n = 30 simulations and error bars show ±1 SD of mean information values obtained in simulations. See ‘Analytical simulations of selection for information’ and Supplementary Fig. 6 for details). d Venn diagrams illustrating the assumptions used to simulate evolutionary scenarios with strong or no diversifying selection in (c). Numbers indicate theoretical percent probability of correct classification (e.g. with a strong diversifying selection, the correct classification probability remains at 80% for all species when a new species emerges, but drops to 64% when no diversifying selection is applied). Source data are provided as a Source data file.

