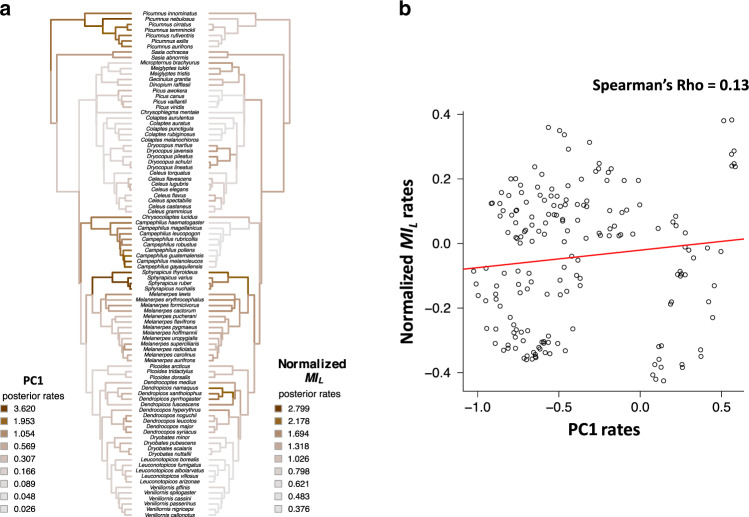
Fig. 4. Evolutionary changes of drumming structure and species-specific information.
a Reconstruction of the evolutionary rates for drumming acoustic structure (‘PC1’) and normalized MIL along the woodpeckers’ phylogeny (n = 92 species). Both trees are based on relaxed-rates Brownian motion evolutionary models. Average posterior rates have been standardized (dividing variables by their respective standard deviation before model computation) and are represented by a colour-gradient (scales indicated in the Figure). These gradients do not indicate an increase or decrease of the absolute trait values, but rather whether the rate of change (i.e. the diversification speed) of a trait increases or decreases. b Correlations between evolutionary rates of acoustic structure (represented by PC1) and MIL. Rates were log-transformed; for acoustic structure represented by PC2-PC6, see Supplementary Fig 10. Source data are provided as a Source data file.

