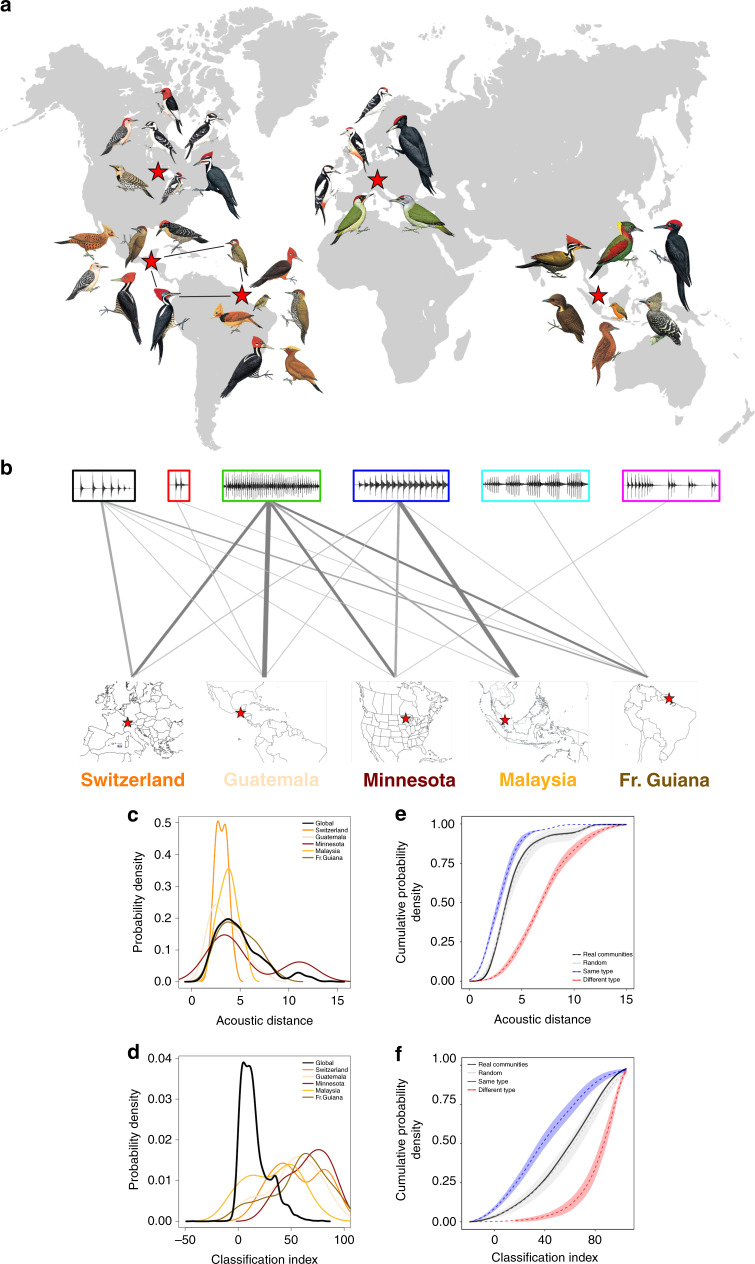
Fig. 6. Drumming within ecological communities.
a Distribution and species composition of the communities examined in this study (background map designed by Layerace/Freepik). b Diversity of drumming types used by sympatric species in ecological communities (from left to right: palaearctic deciduous forest, Switzerland; neotropical forest, Guatemala; nearctic deciduous forest, USA; Indomalayan rainforest, Malaysia; neotropical rainforest, French Guyana; Supplementary Table 8). Line width is proportional to the number of species using a given drumming type. c Average acoustic distance between species pairs either taking all species together (black line, n = 92) or within communities (coloured lines). Acoustic distances are computed as the Euclidean distance between the 22-dimension vectors for each species’ drum. The average acoustic distance mainly shows similar density profiles for the woodpecker family taken as a whole and for species living in sympatry (i.e. within communities), showing an optimal use of acoustic strategies within communities (Supplementary Table 9). d Average Classification Index within species pairs, either taking all species together (black line; n = 92), or within communities (coloured lines). Classification Index ranges from −100 (no correct classification at all) to 100 (maximum correct classification). Compared with the family taken as a whole, sympatric species (i.e. within communities) are much better classified (Supplementary Table 9). e Cumulative distribution of the average acoustic distance within species pairs either taking distances within communities (‘Real Communities’; black line), or randomly sampling species from our full community dataset (i.e. 6 species among 33; grey line), or selecting species each with different drumming types (red line), or selecting species which all have a similar drumming type (blue line). The sooner the cumulative distribution reaches a plateau, the lower the average acoustic distances between species pairs in a simulated community category. f Cumulative distribution of the average Classification Index within species pairs, following the same approach as with acoustic distances (note that computing communities with similar drumming types was limited to 5 species when sampling from the ‘regular sequence’ and/or from the ‘irregular sequence’). The later the cumulative distribution reaches a maximum, the higher the percent correct classification in a simulated community category. For panels (e) and (f), a balanced selection of 5 and 6 species per community was applied to control for a possible effect of the number of species; error envelopes were obtained by bootstrapping (n = 100, curves are mean ± 2 SD) (illustrations of woodpeckers reproduced by permission of Lynx Edicions). Source data are provided as a Source data file.

