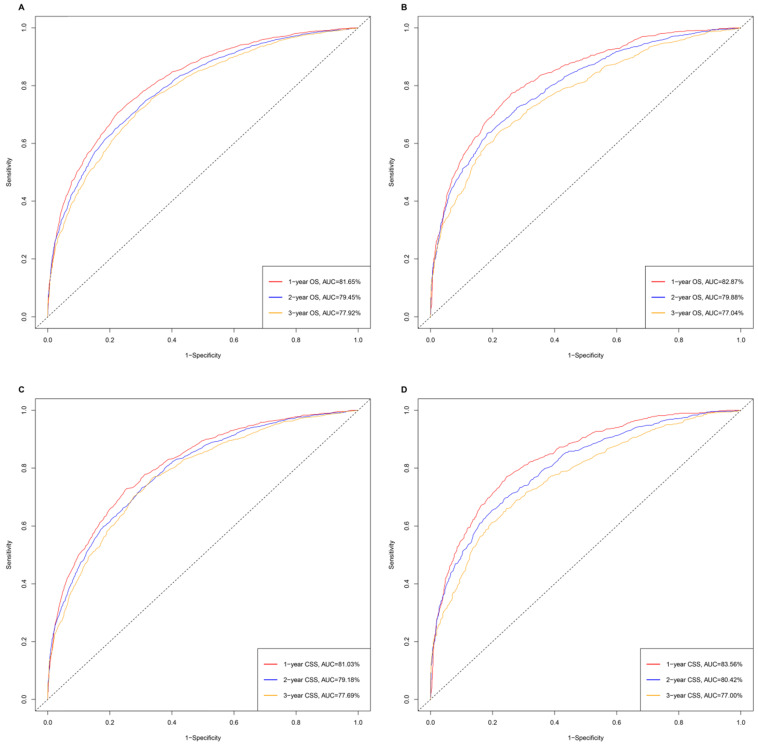
Figure 3.
The time-dependent ROC curves of nomograms. A. The AUC values of ROC were 81.65%, 79.45% and 77.92% regarding nomograms predicting 1-, 2- and 3- year OS in training cohort. B. The 1-, 2-, and 3-year AUC values of the nomogram for OS were 82.87%, 79.88% and 77.04% in validation cohort. C. The AUC values of ROC were 81.03%, 79.18% and 77.69% regarding nomograms predicting 1-, 2- and 3- year CSS in training cohort. D. The 1-, 2-, and 3-year AUC values of the nomogram for CSS were 83.56%, 80.42% and 77.00% in validation cohort.

