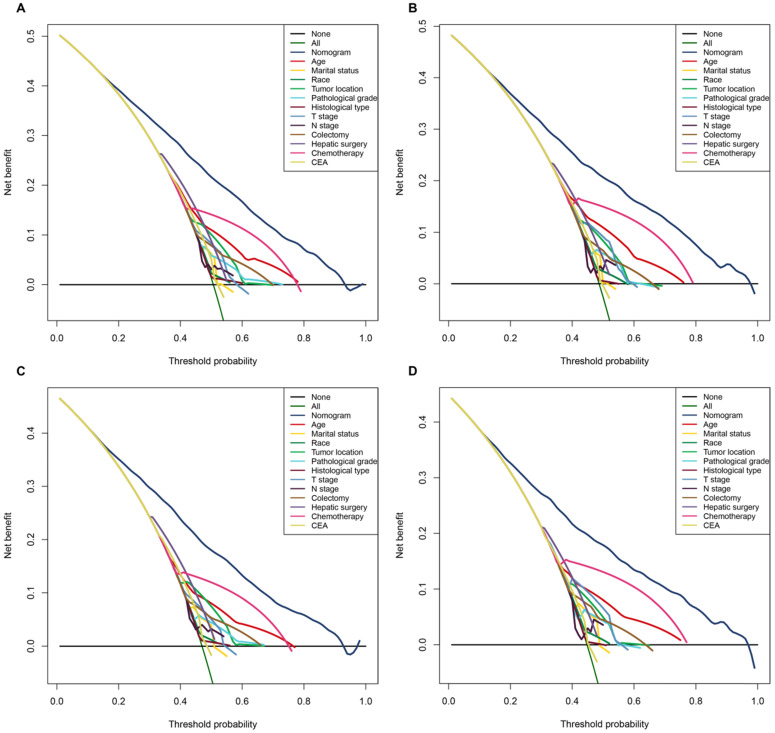
Figure 4.
The decision curve analysis (DCA) demonstrated that the nomograms owned excellent net benefits and was superior to the any single prognostic factors across the wider range of reasonable threshold probabilities in OS and CSS. A. The DCA of the nomogram and all prognostic factors for OS in the training cohort. B. The DCA of the nomogram and all prognostic factors for OS in the validation cohort. C. DCA of the nomogram and all prognostic factors for CSS in the training cohort. D. The DCA of the nomogram and all prognostic factors for CSS in the validation cohort.

