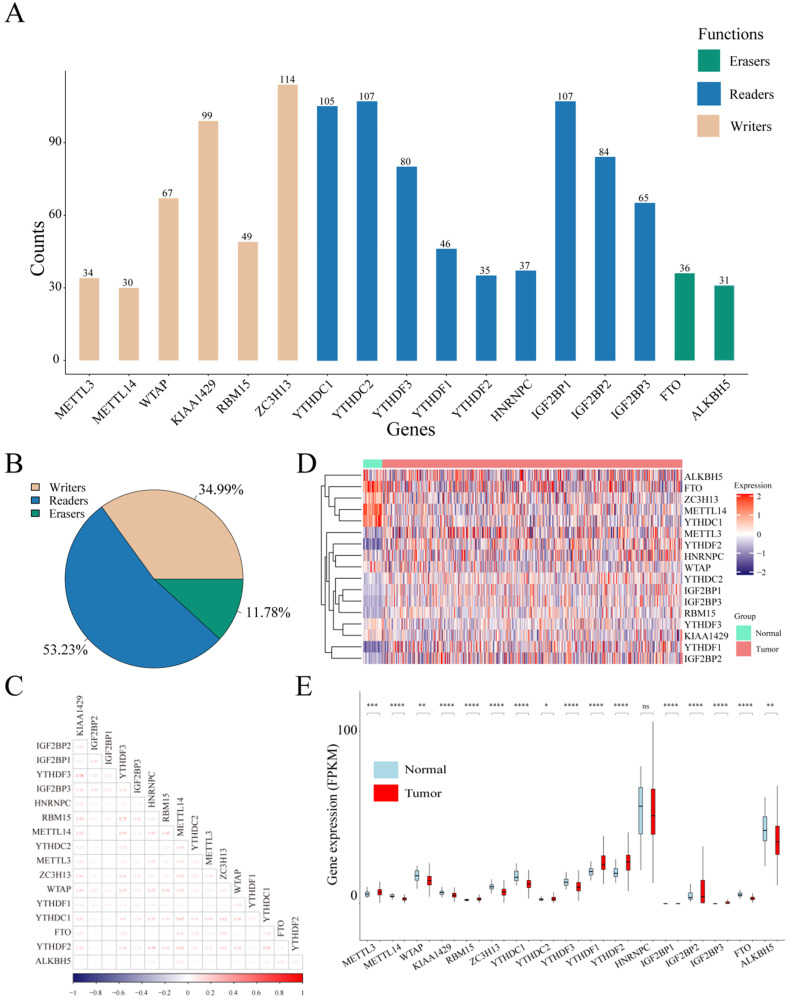
Figure 2.
Mutations and CNVs in m6A regulatory genes in UCEC patients. (A) Frequency of mutations in different m6A regulatory genes in patients' samples. (B) The CNV statistics of m6A regulatory genes in samples. (C) The expression heatmap of m6A regulators in all UCEC samples from TCGA database. (D) The gene expression correlation analysis of m6A regulators. (E) The box plot of m6A regulators in all UCEC samples from TCGA database.

