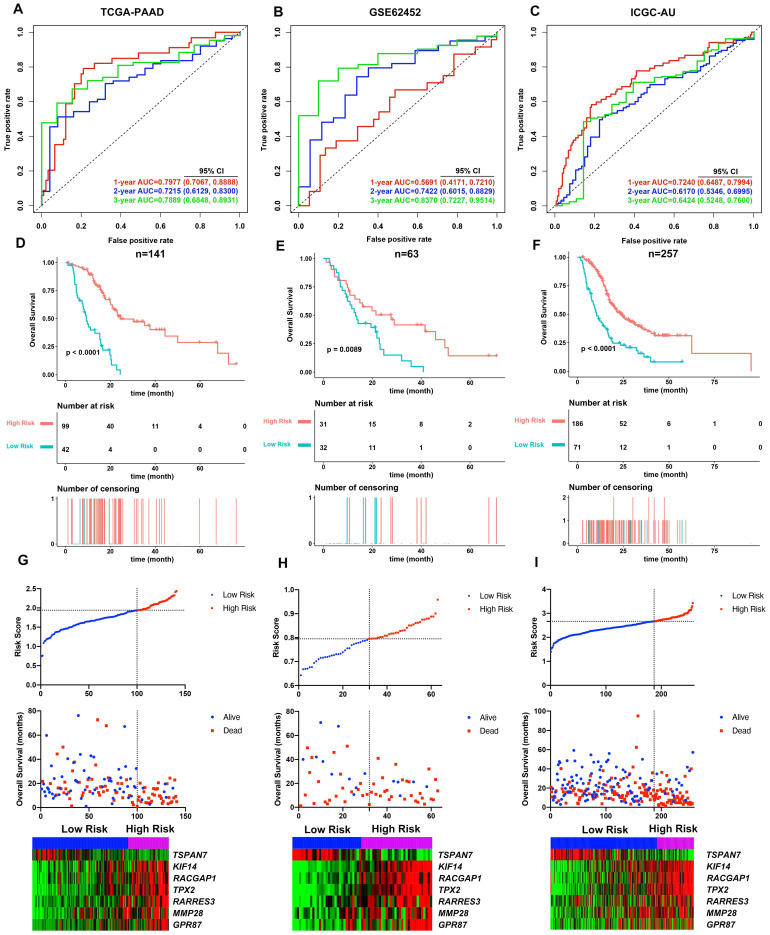
Figure 4.
Evaluation of the performance of the MTG-based gene signature in TCGA-PAAD dataset and external validation in the GSE62452 and ICGC datasets. (A) Time-dependent ROC for 1-, 2- and 3-year predictions of overall survival for the MTG-based gene signature in the TCGA-PAAD dataset. (B) Time-dependent ROC for 1-, 2- and 3-year predictions of overall survival for the MTG-based gene signature in GSE62452. (C) Time-dependent ROC for 1-, 2- and 3-year predictions of overall survival for the MTG-based gene signature in ICGC. (D) Kaplan-Meier survival curves of the MTG-based gene signature. Patients from TCGA-PAAD dataset are stratified into two groups according to the optimal cut-off values for the risk scores determined by X-Tile software. (E) Kaplan-Meier survival curves of the MTG-based gene signature. Patients from the GSE62452 dataset are stratified into two groups according to the optimal cut-off values for the risk scores determined by X-Tile software. (F) Kaplan-Meier survival curves of the MTG-based gene signature. Patients from the ICGC dataset are stratified into two groups according to the optimal cut-off values for the risk scores determined by X-Tile software. (G) Relationship between the risk score (upper), survival status of patients in different groups (middle), and the expression profiles of the seven prognostic DE-MTGs (bottom) in TCGA-PAAD dataset. (H) Relationship between the risk score (upper), survival status of patients in different groups (middle), and the expression profiles of the seven prognostic DE-MTGs (bottom) in the GSE62452 dataset. (I) Relationship between the risk score (upper), survival status of patients in different groups (middle), and the expression profiles of the seven prognostic DE-MTGs (bottom) in the ICGC dataset.

