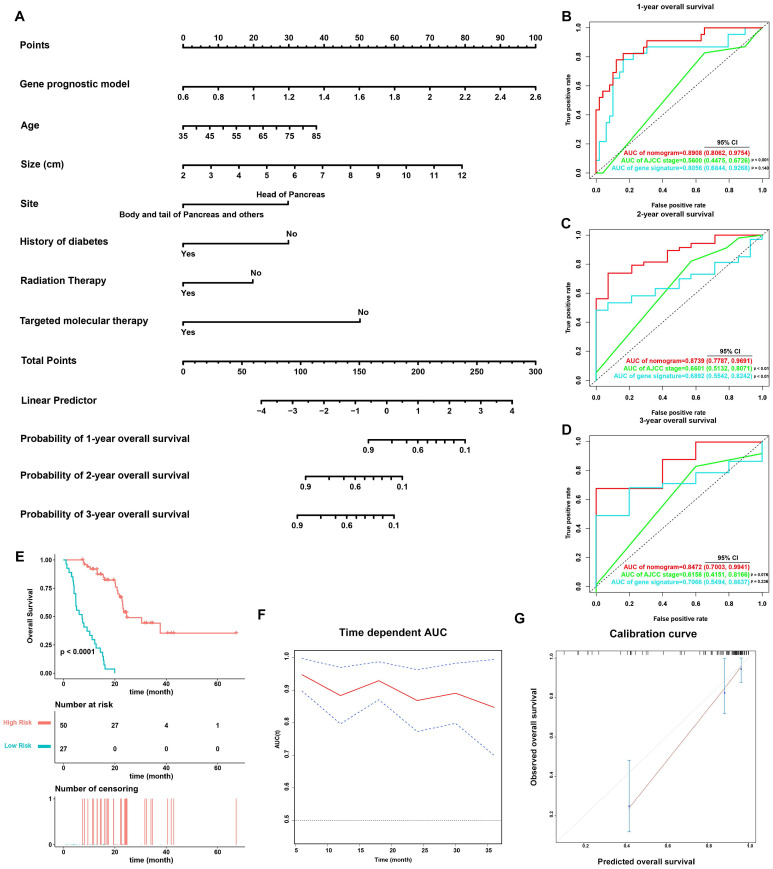
Figure 6.
Validation of the nomogram in predicting overall survival of PDAC in TCGA-PAAD dataset. (A) A prognostic nomogram incorporating MTG-based gene signature predicting 1-, 2- and 3-year overall survival of PDAC. (B-D) Prognostic performance of the gene signature-based nomogram, MTG-based gene signature and AJCC staging system using time-dependent ROC for predicting the 1-, 2- and 3-year overall survival of PDAC. (E) Kaplan-Meier survival curve of the nomogram. Patients from TCGA-PAAD dataset are stratified into two groups of different level of risk according to the optimal cut-off value for the nomogram determined by X-Tile software. (F) The time-dependent AUC of the nomogram in predicting overall survival of PDAC. (G) The calibration plot for internal validation of the nomogram. The Y axis represents the actual overall survival, whereas the X axis represents the predicted overall survival.

