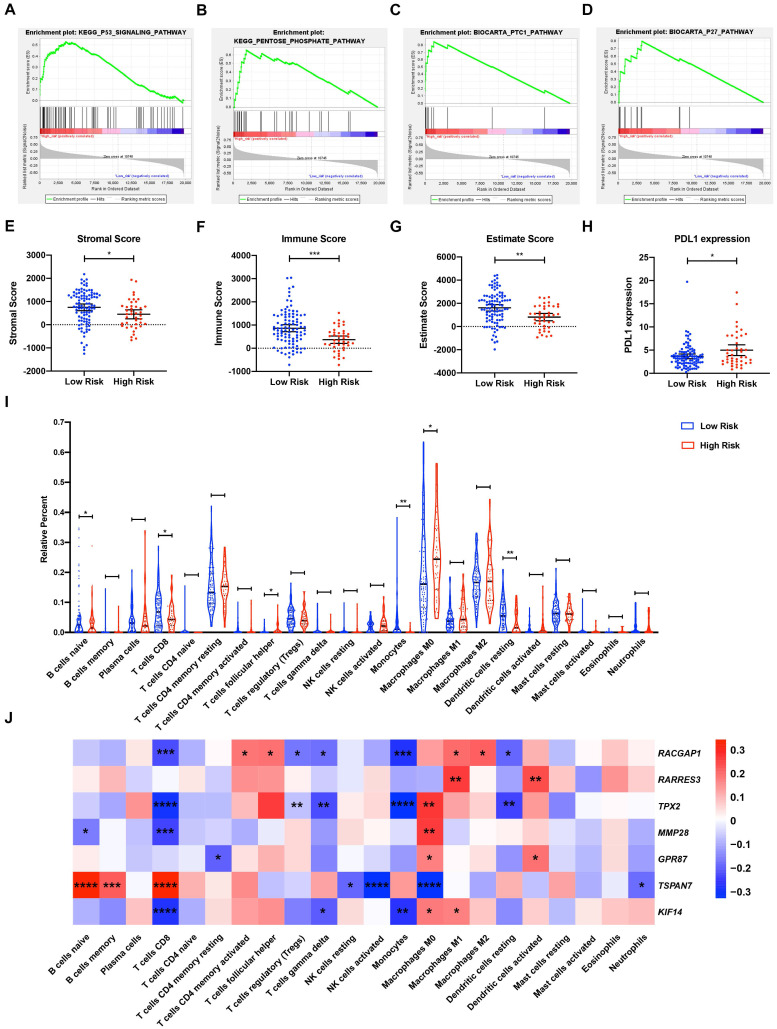
Figure 7.
Gene Set Enrichment Analysis (GSEA) and tumor immunity analysis of the MTG-based gene signature. (A-D) Top signaling pathways and oncological signatures significantly enriched in the high-risk group identified by GSEA. (E-G) Distribution of the Stromal scores, Immune scores, and ESTIMATE scores in high-risk and low-risk groups from TCGA-PAAD dataset. The Stromal scores, Immune scores, and ESTIMATE scores were calculated using the ESTIMATE algorithm (https://bioinformatics.mdanderson.org/public-software/estimate/). (H) Differentially expressed PDL1 between the high-risk and low-risk groups of TCGA-PAAD dataset. (I) Differential immune infiltrates in high-risk and low-risk groups of TCGA-PAAD dataset. The proportion of 22 immune infiltrates for each case are estimated using the CIBERSORT algorithm (https://cibersort.stanford.edu/index.php). (J) Correlation matrix of the relationship between the expression of the seven prognostic DE-MTGs and the differential immune infiltration levels. Pearson correlation analysis was used to calculate the correlations. Colors from blue to red present the Pearson correlation coefficient. * p < 0.05, ** p < 0.01. *** p < 0.001. **** p < 0.0001.

