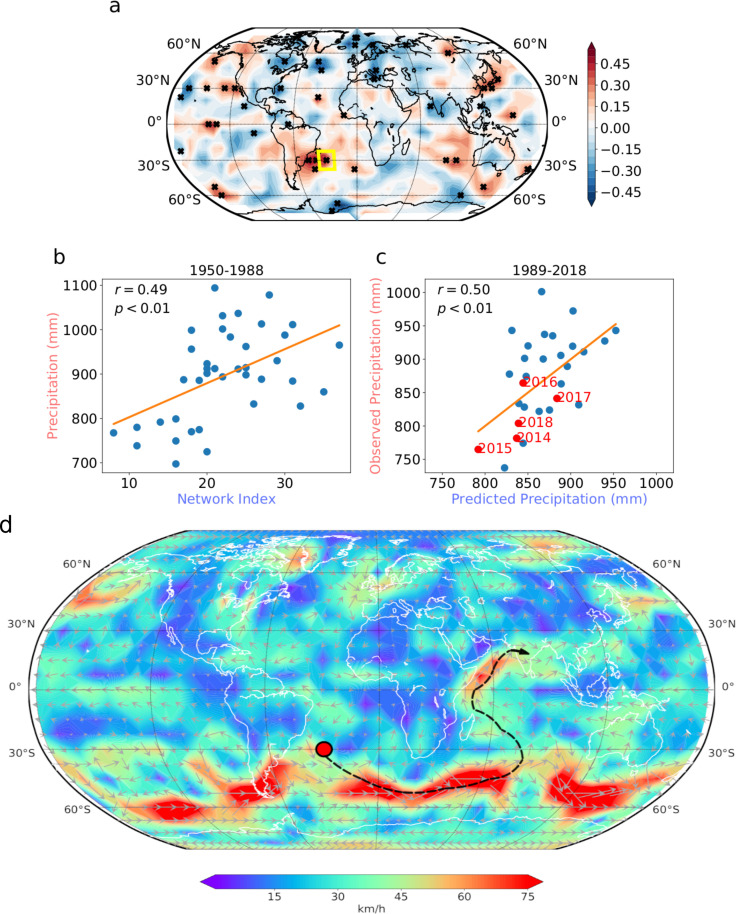
Fig. 27.
Schematic of ISM rainfall forecasting based on climate networks. (a) The correlation coefficients between observed AIRI and in-degree time series during the training period for all nodes. (b) Scatter plots of the observed AIRI versus the optimized network predictor (i.e., the in-degree time series of the key node in the yellow box) in the training period. (c) Scatter plots of the observed AIRI versus the predicted AIRI during the forecast period 1989–2018. (d) Teleconnection path between the key node in South Atlantic and Indian subcontinent. Black in panel (a) represent the regions with correlations significant at the 95% confidence level (Student’s t-test). The recent five years are highlighted in red in panel (c). The colors and gray arrows depict the magnitudes and directions of the 850 hPa winds on 12th August 2014 during the Indian summer monsoon season in panel (d).
Reprinted figure from Ref. [323].

