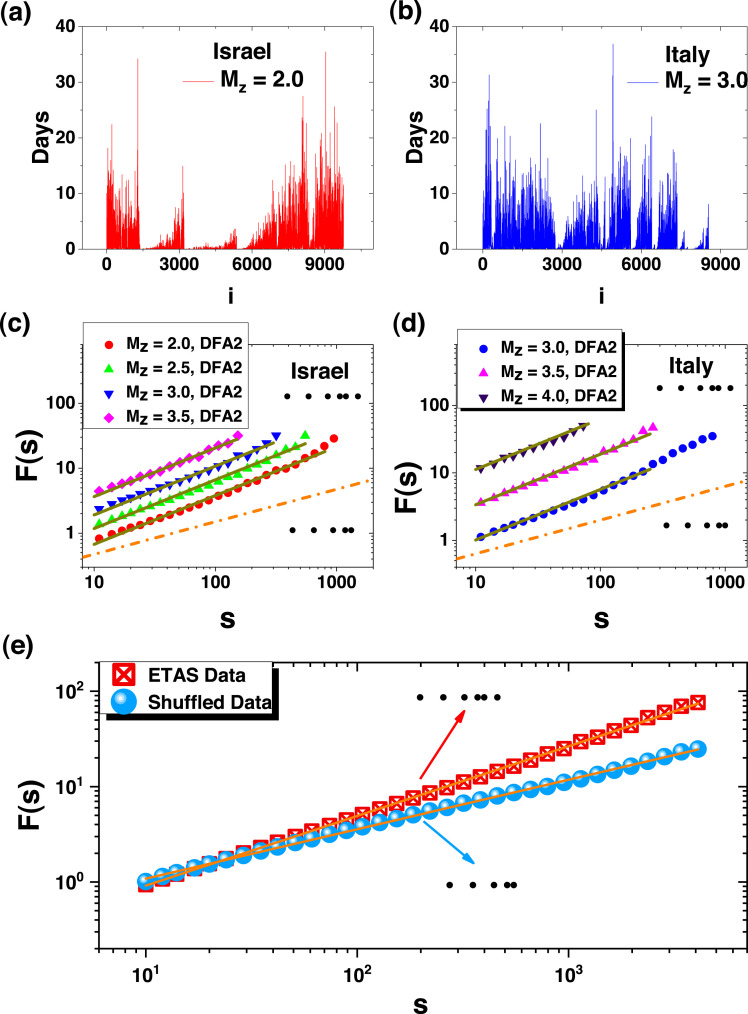
Fig. 46.
Interoccurrence time series and DFA from the Israeli, Italian and ETAS catalogs. (a) Interoccurrence time series between earthquake events from the Israeli (a) and Italian (b) catalogs using magnitude threshold . DFA of the interoccurrence times from the (c) Israeli and (d) Italian catalogs with different values. (d) DFA of the interoccurrence times from the ETAS model, with parameters , , , and , see Eq. (139). The solid line is the best fitting line with slope , R-square . For comparison, the shuffled data with slope , indicating no memory, are presented in (d).
Reprinted figure from Ref. [212].

