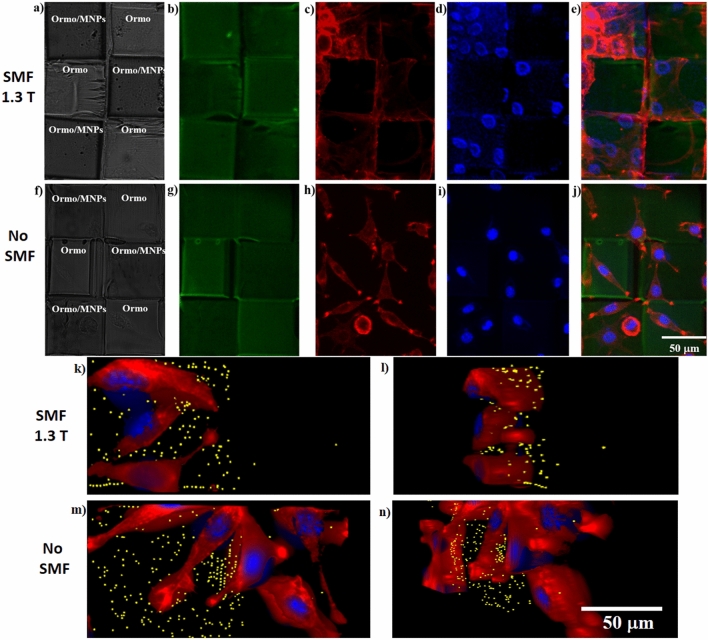
Figure 3.
2D microarrays: (a, f) Optical images; (b, g) Green autofluorescence; Representative fluorescence microscope images of fibroblasts seeded on 2D microarrays: (c, h) cytoskeleton (red) visualized by staining with F-actin; (d, i) nuclei (blue) visualized by staining with Hoechst; (e, j) overlapped fluorescence images of 2D microarrays, cells cytoskeleton and nuclei; (k, m) 3D top and (l, n) 3D tilted views of cells nuclei (blue), cytoskeleton (red) and centers of MNPs and agglomerations of MNPs (yellow), imaged by enhanced dark field microscopy. The samples were imaged in the presence (a–e, k, l) and absence (f–j, m, n) of SMF. All cells were imaged after 1 day of cell culture.

