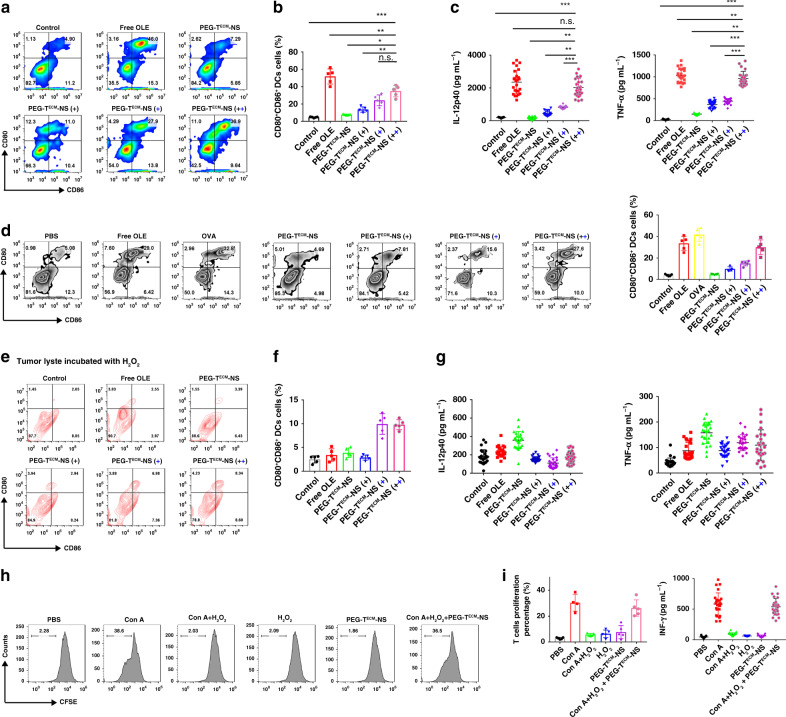
Fig. 4. ICD-associated DAMPs from 4T1 cells induce the maturation of BMDCs in vitro.
a 4T1 cells were incubated with free OLE and PEG-TECM-NS/OLE with or without pretreatment pH 6.8 buffer and H2O2, followed by co-culture with BMDCs. The cells were then labelled with CD86 and CD80, and mature DCs were measured using flow cytometry. Black plus represents that PEG-TECM-NS/OLE was pretreated with pH 6.8 buffer. Blue plus represents that PEG-TECM-NS/OLE was pretreated with H2O2. b Quantitative analysis of CD80+CD86+ DCs (n = 5 independent replicates). c Quantification of secretion of IL-12p40 and TNF-α in DC suspensions (n = 25 independent replicates). d 4T1 cells were incubated with free OLE and PEG-TECM-NS/OLE with or without pretreatment (pH 6.8 buffer (4 h) and H2O2 (24 h)) to obtain the tumour lyste. Then mice were immunized intravenously with the tumour lyste three times. Seven days after the third immunization, lymph nodes were harvested to measure the percentage of CD80+CD86+ DCs by flow cytometry (left). Quantification of CD80+CD86+ DCs (right) (n = 5 independent replicates), OVA served as the control antigen. e, f The supernatants of 4T1 cells incubated with free OLE and PEG-TECM-NS/OLE with or without pH 6.8 buffer and H2O2 pretreatment were oxidized by H2O2. Then BMDCs were co-cultured with oxidized supernatants from 4T1 cells for 3 days with different treatments. Representative flow cytometric plots of mature BMDCs (e) and quantification result (f) (n = 5 independent replicates). g Quantification of secretion of IL-12p40 and TNF-α in DC suspensions (n = 25 independent replicates). h T cells were acquired from spleens and labelled with CFSE. T cells were cultured with PEG-TECM-NS, 100 µM H2O2, and PEG-TECM-NS with 100 µM H2O2. The proliferated T cells were measured using flow cytometry. i Quantification of T-cell proliferation (n = 5 independent replicates) and IFN-γ in T-cell culture medium (n = 25 independent replicates). All error bars represent mean ± s.d. Statistical significance was evaluated using Student’s unpaired t test. Asterisks indicate p values *P < 0.05, **P < 0.01, and ***P < 0.001 and n.s. represents no significant difference.

