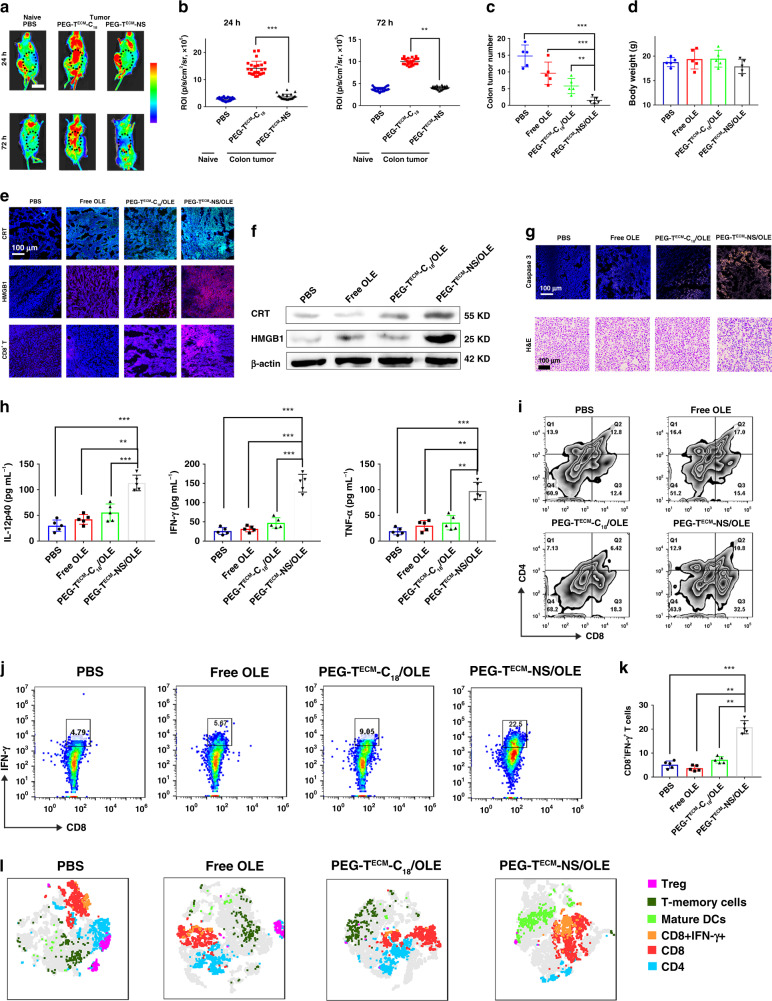
Fig. 6. In vivo antitumour and ROS scavenging activity of PEG-TECM-NS/OLE in CT26 orthotopic colorectal cancer model.
a In vivo chemiluminescence imaging of ROS in tumour microenvironment by L-012. b Quantification of L-012 chemiluminescence (n = 5 biologically independent mice). c Colon tumour numbers after different treatment (n = 5 biologically independent mice). d Body weight of orthotopic colorectal cancer mice after different treatments (n = 5 biologically independent mice). e Immunofluorescence of HMGB1, CRT, and CD8+ T cells in the tumour tissues after different treatments. f Western blot analysis of HMGB1 and CRT expression levels in the tumour tissues. The samples were derived from the same experiment and the gels were run in parallel. g Caspase-3 staining and H&E staining of the tumour tissues with different treatments. h Quantification of secretion of IL-12p40, IFN-γ, and TNF-α in sera from mice (n = 5 biologically independent mice). i CD8+ T cells in 4T1 tumour analyzed by flow cytometry. j The determination of IFN-γ positive CD8+ T cells (CD8+IFN-γ+ T cells) within tumour by flow cytometry. k Quantitative analysis of IFN-γ+CD8+ T cells (n = 5 biologically independent mice). l T-distributed stochastic neighbour embedding (t-SNE) visualization of clustering of representative markers of cells from tumour detected by flow cytometry, each dot corresponds to one single cell. All error bars represent mean ± s.d. Statistical significance was evaluated using Student’s unpaired t test. Places needing multiple comparisons were evaluated by one-way ANOVA. Asterisks indicate p values *P < 0.05, **P < 0.01, and ***P < 0.001 and n.s. represents no significant difference.

