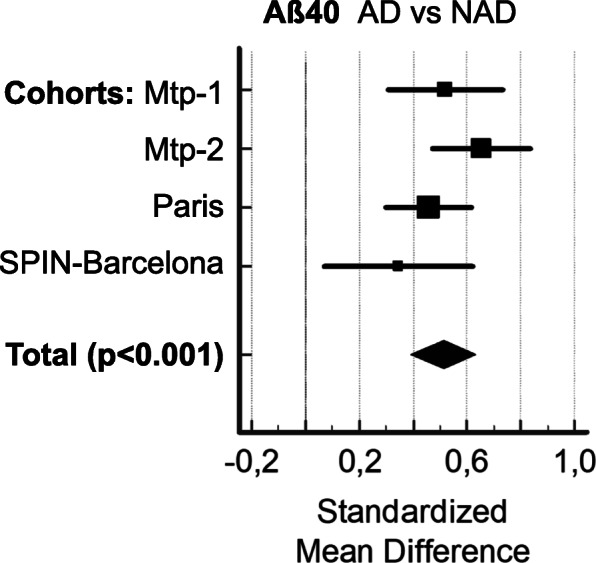
Fig. 2.

Meta-analysis including the four independent cohorts. We used with to compare the Aβ40 means between AD and NAD populations the Hedges g statistic as a formulation for the standardized mean difference (SMD) under the fixed effects model. The SMD Hedges g is the difference between the two means divided by the pooled standard deviation. The plot has marker sizes relative to study weight. The results of the different studies, with 95% CI, and the overall standardized mean difference with 95% CI are shown. Cohen’s rule of thumb for interpretation of the SMD statistic is that a value of 0.2 indicates a small effect, a value of 0.5 indicates a medium effect, and a value of 0.8 or larger indicates a large effect
