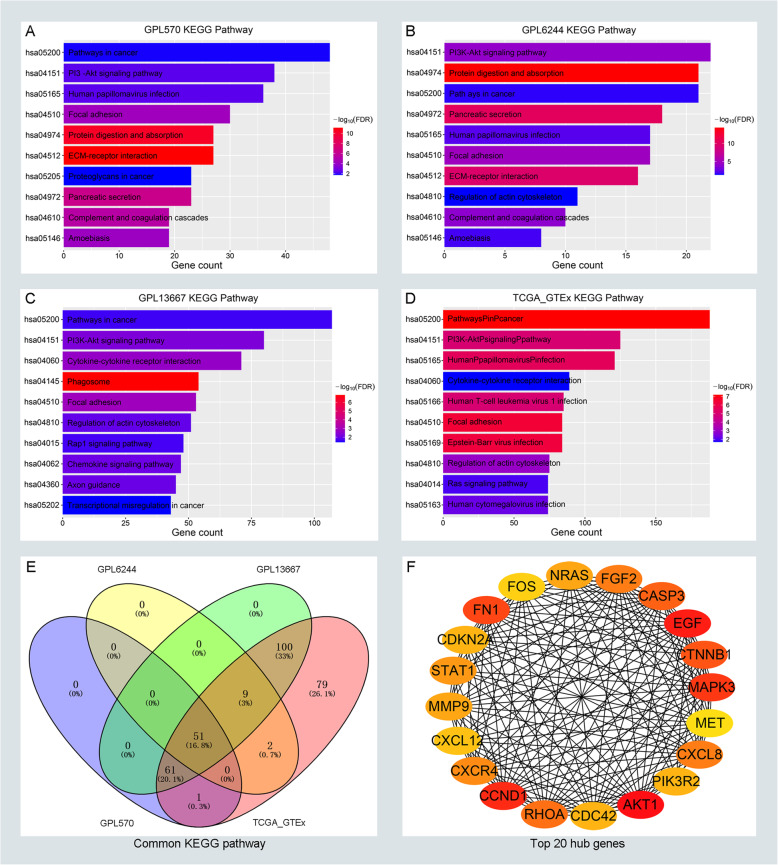
Fig. 3.
KEGG enrichment analysis for DEGs and identifying hub genes in cancer-related pathways of PC. The top ten significantly enriched the KEGG pathway in GPL570 (a), GPL6244 (b), GPL13667 (c), and TCGA_GTEx (d) respectively. e The distribution of enriched KEGG pathways in GPL570, GPL6244, GPL13667, and TCGA_GTEx. f The top 20 hub genes of DEGs in pathway in cancer. The depth of color represents the connection degree of genes. Red represents a high connection degree and yellow represents low connection. The number of lines represents the degree of connection between genes, and the more lines, the tighter the connection

