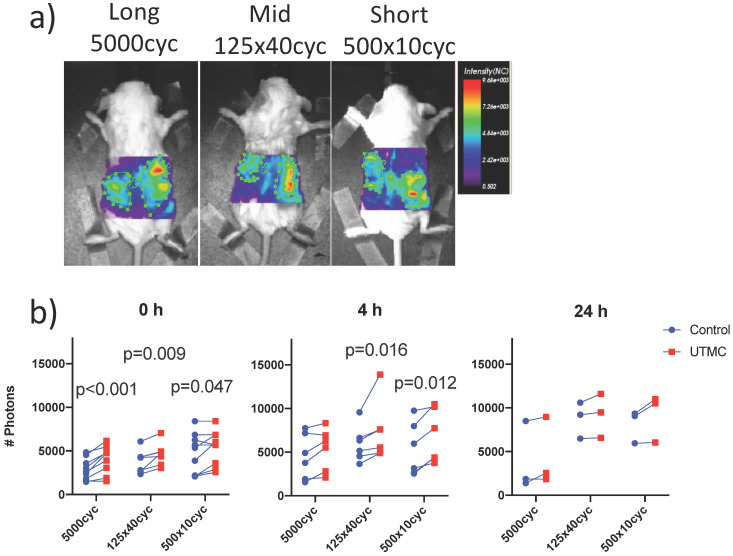
Figure 6.
Biofluorescence imaging: a) Mice bearing bilateral tumors received an intravenous bolus of fluorescently labeled antibodies (anti-CD73-F) and were treated with UTMC on the right side only and were imaged by biofluorescence; b) Fluorescent signal for each mouse comparing right and left tumors at 0 h, 4 h and 24 h. Two-way ANOVA (side, pulse) was significant for side at all time points (p<0.02). Numerical p-values<0.05 are indicated (SIDAK multiple comparison testing. N=9 at 0 h, N=6 at 4 h and N=3 at 24 h.

