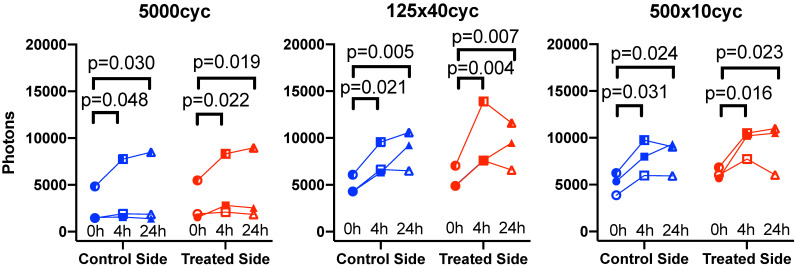
Figure 7.
Longitudinal biofluorescence signal as a function of side for different UTMC pulses: The fluorescence signals measured in control and treated tumors are plotted as a function of time for the three mice per group that were serially imaged at 0 h, 4 h and 24 h. Data from the same animal are linked by a line. Compared to 0 h, the signal increased in all groups at 4 h and 24 h but was similar between 4 h and 24 h, indicating a plateau between 4 and 24 h. Numerical p-values<0.05 are indicated (SIDAK multiple comparison testing; N=3 per group).

