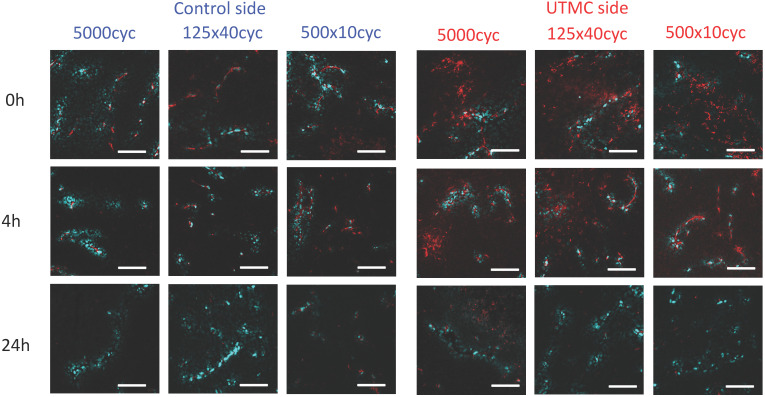
Figure 8.
The effect of UTMC on antibody microstructural distribution around vessels as a function of time on control and UTMC treated side for different ultrasound pulses: Typical confocal images of tumors at 0 h, 4 h and 24 h after receiving UTMC. Vessels are stained in blue (perfusion stain injected IV before sacrifice) and antibodies carry a red fluorophore (AF680). Scale bar =100 μm.

