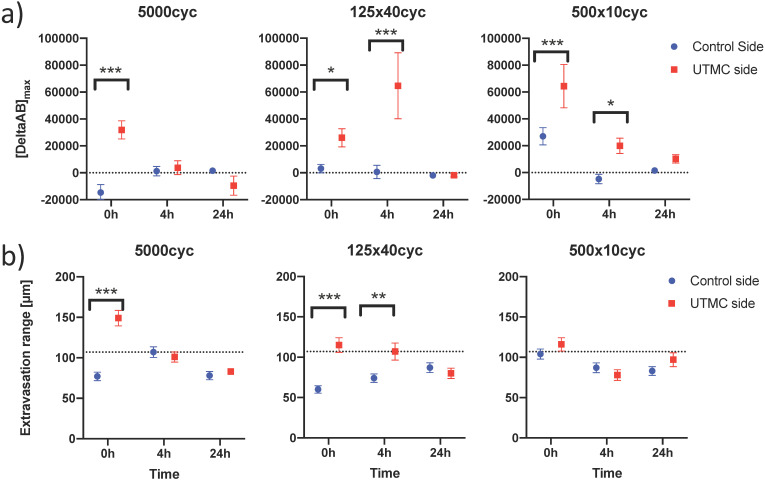
Figure 9.
Confocal data analysis: (a) Differential extravasated antibody signal [DeltaAb]max; and (b) Extravasation range for each UTMC treatment as a function of side for each timepoint. Data in this graph are plotted as mean ± standard error of the mean. N=3 mice per group (only 2 mice for 500x10cyc at 4 h, see results section) and >90 vessels analyzed per side for each condition. Data was analysed using Two-way ANOVAs (side, time): for [DeltaAB]max, all p<0.05 for side and time; for extravasation range, all p<0.001 for side and time. *, ** and *** indicate respectively p<0.05, p<0.01 and p<0.001 from Fisher LSD multi comparison testing. Numerical data and statistics are reported in Table 3.

