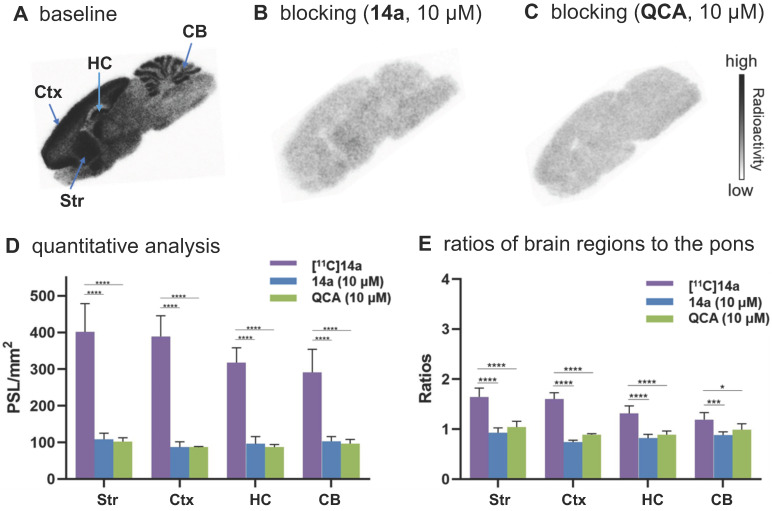
Figure 3.
In vitro autoradiography of [11C]14a in rat brain sections. (A) Brain sections were treated with [11C]14a (1.25 μCi/mL); (B) Brain sections were pre-treated with 14a (10 μM), followed by [11C]14a (1.25 μCi/mL); (C) Brain sections were pre-treated with QCA (10 μM), followed by [11C]14a (1.25 μCi/mL); (D) Quantitative analysis of baseline and blocking experiments. The value is expressed as PSL per mm2; (E) Ratios of brain regions to the pons. Str = striatum; Ctx = cerebral cortex; HC = hippocampus; CB = cerebellum. Six serial brain sections were used for each conditions. Data are presented as mean ± SEM (n = 6) and analyzed by one-way ANOVA. Asterisks indicate statistical significance. *p < 0.05, ***p ≤ 0.001, and ****p ≤ 0.0001.

