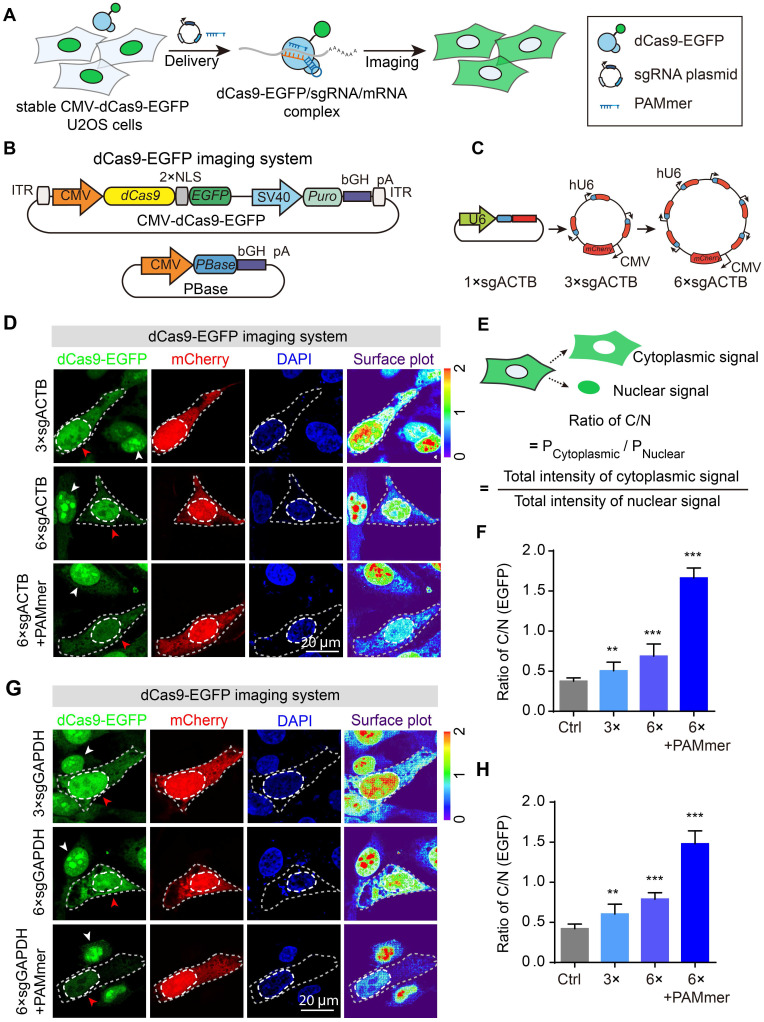
Figure 2.
Tandem sgRNA expression cassettes for imaging of ACTB or GAPDH mRNA in the dCas9-EGFP imaging system. (A) Workflow for the dCas9-EGFP imaging system. Stable CMV-dCas9-EGFP U2OS cells were transfected with sgRNAs and PAMmers for subsequent mRNA imaging. (B) PiggyBac (PB) vector maps for constructing stable CMV-dCas9-EGFP U2OS cells. (C) Diagram of the expression vectors for sgRNA; 3 × or 6 × sgRNAs were co-expressed in one vector. The sgRNA targeting ACTB mRNA was constitutively transcribed from the human U6 polymerase III promoters, and mCherry, which was used to label the transfected cells, was under the control of the CMV promoter. (D) dCas9-EGFP imaging of ACTB mRNA in stable CMV-dCas9-EGFP U2OS cells using different sets of sgRNAs with or without PAMmers. The gray dotted lines delineate the cellular boundaries, and the white dotted lines delineate the cellular nuclei. Each inset (right panel) shows a surface plot representing a two-dimensional graph of the intensity of dCas9-EGFP. Scale bars, 20 µm. (E) Schematic diagram for the calculation of fluorescence ratio of cytoplasmic-to-nuclear (ratio of C/N). (F) Quantification of the EGFP intensity for labeling of ACTB mRNA based on the ratio of C/N (n = 104, 90, 96, 96 cells). (G) dCas9-EGFP imaging of GAPDH mRNA in stable CMV-dCas9-EGFP U2OS cells using different sets of sgRNAs with or without PAMmers. Scale bars, 20 µm. (H) Quantification of the EGFP intensity for labeling of GAPDH mRNA based on the ratio of C/N (n = 88, 98, 121, 110 cells). The data are displayed as the mean ± S.E.M. An unpaired t test was used. **P < 0.01, ***P < 0.001.

