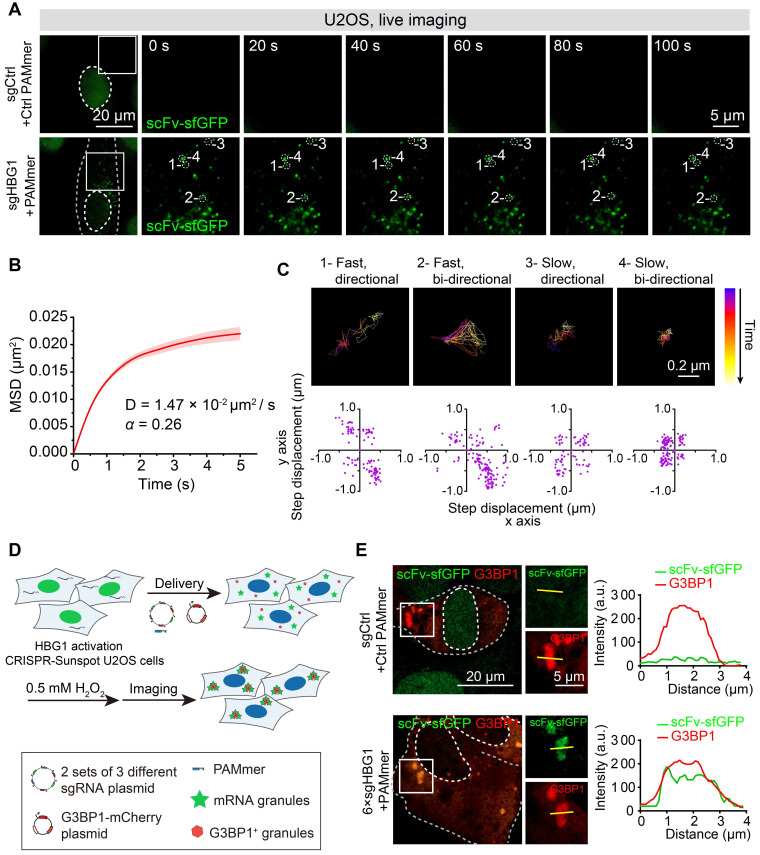
Figure 9.
Tracking mRNA movement and trafficking to stress granules in live cells with CRISPR-Sunspot. (A) CRISPR-Sunspot mediated time-lapse imaging of HBG1 mRNA in live HBG1 activation U2OS cells. See also Video S3 and S4. Scale bars, 20 µm and 5 µm. (B) MSD curves and the Diffusion coefficients of single particles in the cytoplasm analyzed from at least 40 cells. (C) Representative trajectories of four single-particles with different movement modes. Scale bars, 0.2 µm. Scatterplots of the step displacement (δx, δy) of CRISPR-Sunspot labeling of mRNA in 120 s. Puncta were tracked every 1 s. (D) Schematic plots of CRISPR-Sunspot mediated imaging of HBG1 mRNA trafficking to stress granules. (E) Representative images of CRISPR-Sunspot labeling of HBG1 mRNA (green) and stress granules (G3BP1, red) upon hydrogen peroxide (0.5 mM, for 1h) treatments. Scale bars, 20 µm and 5 µm (right panel). Plots of the arbitrary units (a.u.) along the line indicated the fluorescence intensity in the high-magnification images.

