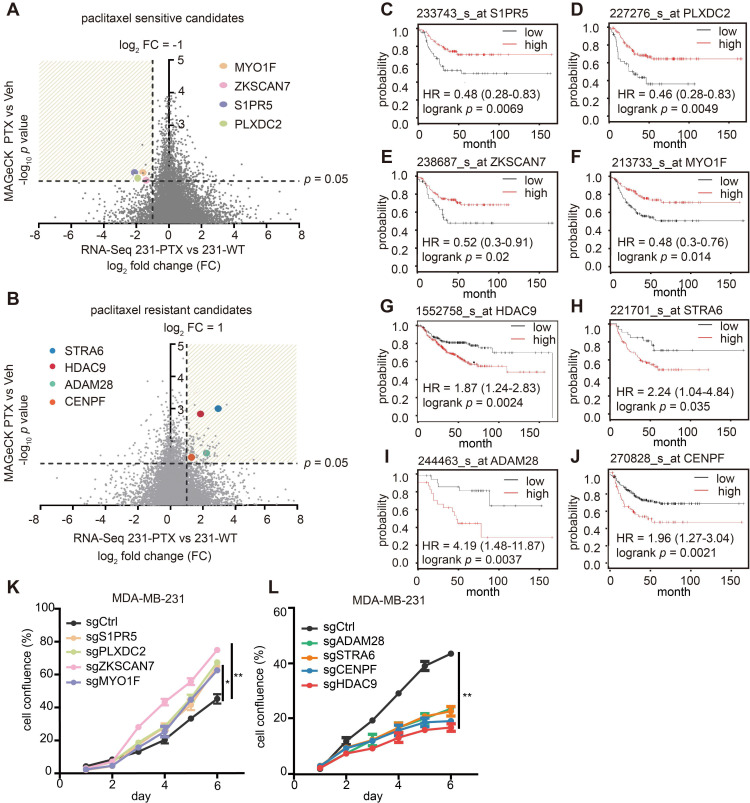
Figure 2.
Paclitaxel-sensitive/resistant candidates and their clinical prognostic values in breast cancer. (A-B) Volcano plot displays gene distribution of paclitaxel-sensitive (A) paclitaxel-resistant (B) candidates. X-axis represents log2-fold change of 231-PTX versus 231-WT and Y-axis represents log10 p value of CRISPR/Cas9-positive (A) / (B) -negative screening. (C-F) Kaplan-Meier analysis of paclitaxel-sensitive candidates. Relapse-free survival Kaplan-Meier plots were based on gene expression, and the auto-select best cut-off was used to sort patients (p < 0.05). (G-J) Kaplan-Meier plot of paclitaxel-resistant candidates. Relapse-free survival Kaplan-Meier plots were based on gene expression, and the autos-elect best cut-off was used to sort patients (p < 0.05). (K-L) Cell growth after individual gene knock-out with single guide (sg) RNA was evaluated following treatment with 1 nM paclitaxel or DMSO for 6 d (*: p < 0.05; **: p < 0.01).

