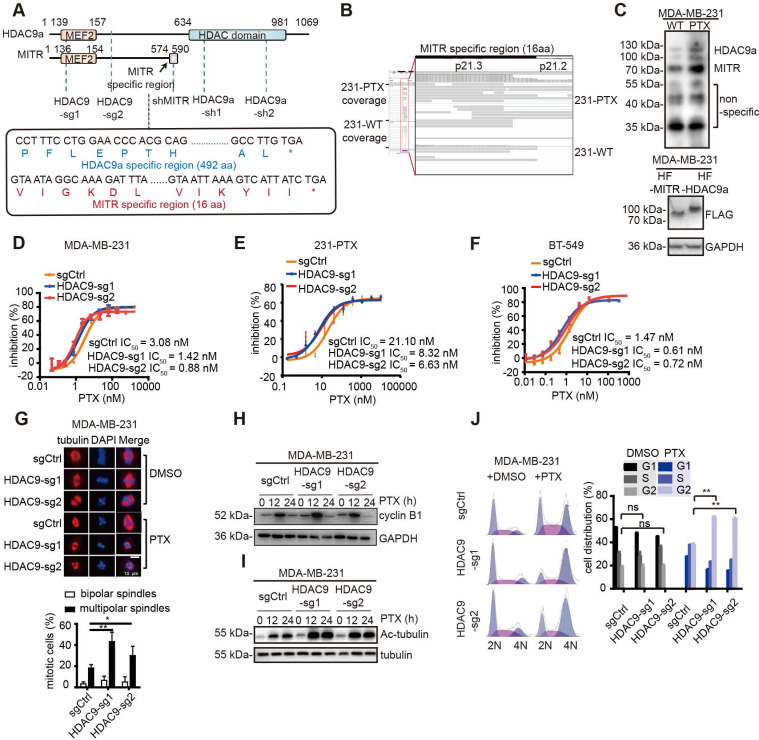
Figure 3.
HDAC9 plays a critical role in paclitaxel resistance. (A) Schematic illustration of HDAC9 isoforms, as well as regions with sgRNA knockout and shRNA knockdown. The specific MITR region includes the C terminus of 16 amino acids, and the specific HDAC9a region starts from amino acid 609. (B) IGV screenshot of MITR and HDAC9a specific region in 231-PTX and 231-WT. (C) Western blotting of HDAC9 isoforms (MITR and HDAC9a) in 231-PTX and 231-WT cells (left), along with HDAC9 isoforms detected by FLAG-tag in MDA-MB-231 cells transfected with MITR and HDAC9a pdest-HA-FLAG vectors (right). (D-F) Cytotoxicity assay in HDAC9 knockout and control MDA-MB-231, 231-PTX and BT-549 cells treated with 3-serial-diluted paclitaxel dose for 72 h. The concentration of paclitaxel for half of the cell viability (IC50) was calculated (HDAC9-sg1 & HDAC9-sg2 vs sgCtrl: p < 0.05). (G) Representative confocal images of endogenous α-tubulin in HDAC9 knockout and control MDA-MB-231 cells at the middle of the mitotic period post-treatment with 1 nM paclitaxel (PTX) or DMSO for 48 h. Bar scale is 10 µM. Nucleus was stained with DAPI. Comparison of multipolar and bipolar spindle foci in HDAC9 sgRNA and control cells subject to paclitaxel treatment in three independent experiments (**: p < 0.01; *: p < 0.05). (H-I) Western blot images of cyclin B1 (H) and acetylated tubulin (I) in HDAC9 knockout and control MDA-MB-231 cells treated with 10 nM PTX or DMSO for different lengths of time. (J) Representative images of cell cycle in HDAC9 knockout and control MDA-MB-231 cells, treated with 10 nM PTX or DMSO for 12 h. Flow cytometry analysis of cell phase distribution was quantified, and each cell phase of different groups was measured and compared using two-sided Student's test (ns: p ≥ 0.05; **: p < 0.01). All data are expressed as mean ± sem.

