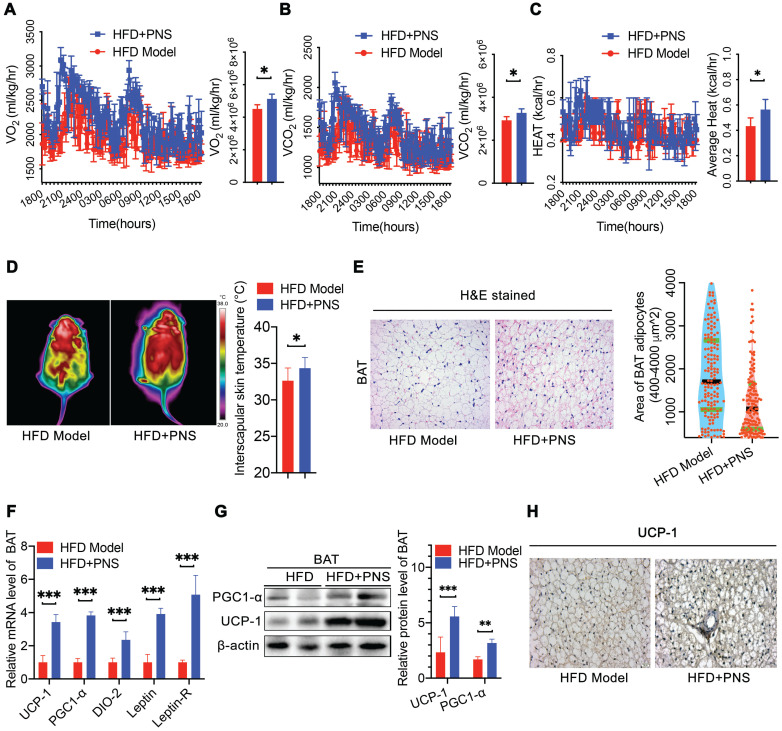
Figure 2.
PNS-treated mice exhibited increased energy expenditure and thermogenesis. (A-C) Evaluation of various energy expenditure parameters and results from the average AUC analysis of oxygen consumption (VO2) (A), carbon dioxide (VCO2) (B) and heat (expressed as Kcal/h) (C) during a 12-h light/dark cycle in HFD induced obese mice treated with vehicle (HFD, n = 5) or PNS (HFD+PNS, n = 5). (D) Representative infrared thermography analysis and interscapular skin temperature of the HFD and HFD+PNS groups (n = 6 mice per group). (E) H&E-stained sections of brown adipocyte tissue of the HFD and HFD+PNS groups. (scale bar: 20 µm) and area of brown adipocytes in the HFD and HFD+PNS groups. (F) Relative mRNA expression of the BAT markers UCP-1, PGC1-α, DIO-2, leptin and leptin-R in the HFD and HFD+PNS groups. (G) UCP1 and PGC1α protein levels in BAT. β-actin was used as a loading control. (H) Staining of UCP-1 in brown adipocytes of the HFD and HFD+PNS groups (scale bar: 20 µm). The values are presented as the mean± SEMs. Significant differences compared with the vehicle controls are indicated by asterisks: *P < 0.05, **P < 0.01 and ***P < 0.001.

