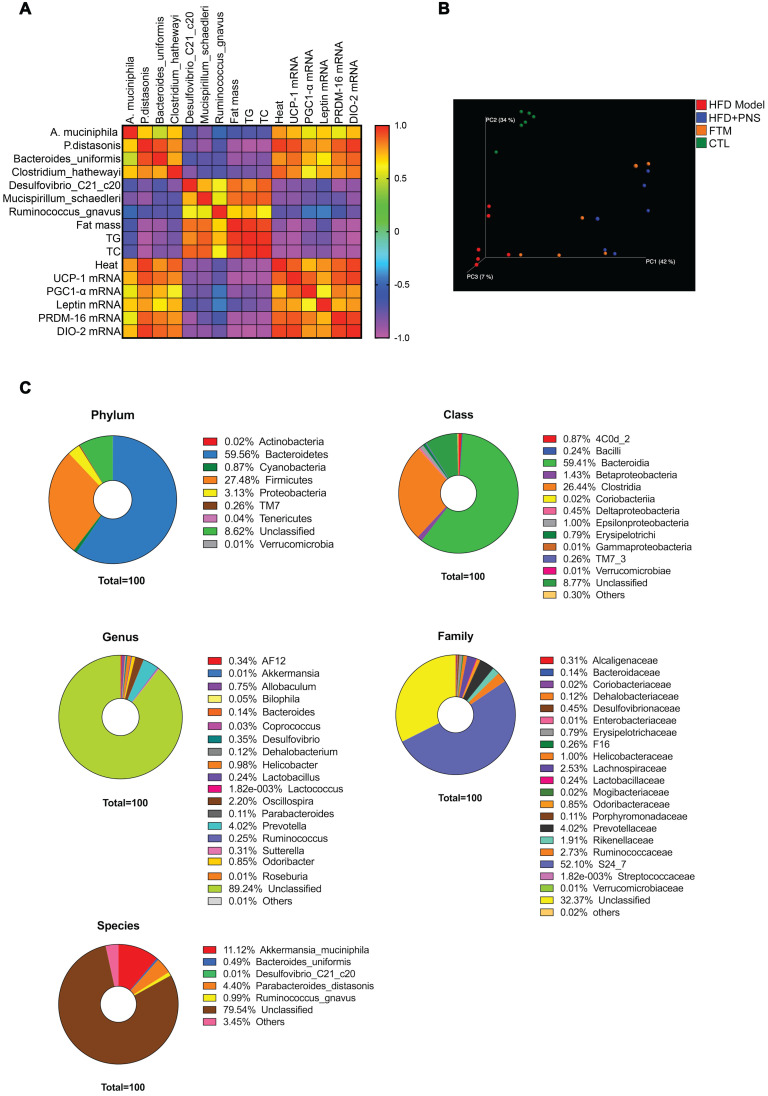
Figure 6.
Identification of PNS microbiota (A) Heat map of the Spearman r correlations between the bacterial genera and the metabolic parameters measured in HFD mice treated with vehicle or PNS (n = 6/group). (B) The 3D PCoA plot of the β diversity based on the weighted UniFrac distances among the HFD, HFD+PNS, CTL and FMT groups. (C) Bacterial taxonomic profiling of bacteria from FTM at the phylum, class, genus, species and family level.

