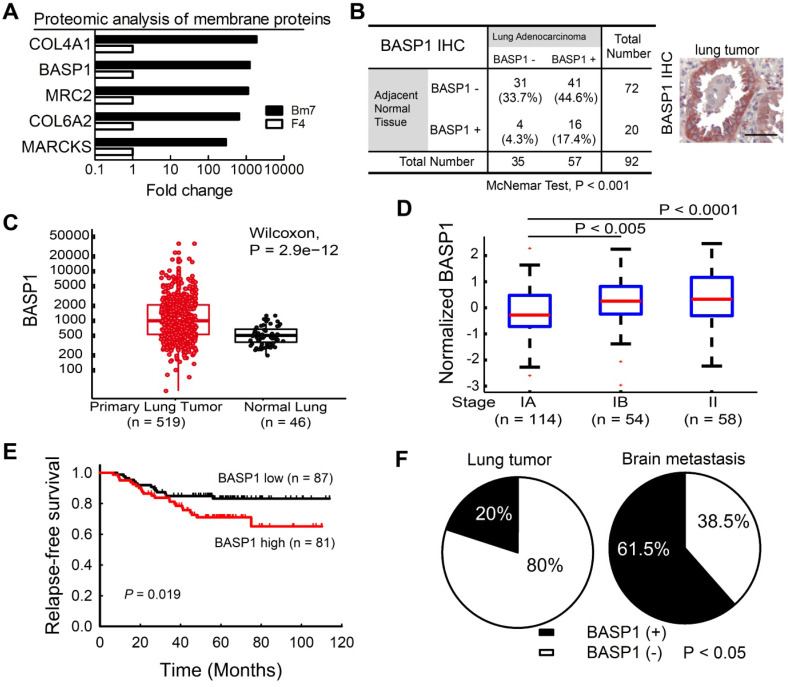
Figure 1.
Higher BASP1 expression correlates with poorer prognosis in lung adenocarcinoma patients. (A) The levels of membrane proteins from established brain-metastatic subline Bm7 and parental F4 lung cancer cells were identified by liquid chromatography-mass spectrometry (LC/MS). COL4A1: collagen type IV alpha-1 chain; MRC2: C-type mannose receptor 2; COL6A2: collagen type VI alpha-2 chain. (B) IHC analysis of BASP1 in a human lung adenocarcinoma tissue array scored by staining intensity from 0 to 3+ by a histologist. A score of 0 to 1+, and 2 to 3+, indicate negative and positive staining of BASP1, respectively. Matched lung adenocarcinoma and adjacent normal tissues from the same patients were analyzed for the distribution of BASP1 staining by the McNemar method. Representative staining for BASP1 is shown (right). Scale bar, 50 μm. (C) Box plot of BASP1 expression in primary lung tumor samples (n = 519) and normal lung tissue samples (n = 46) from the TCGA LUAD dataset. Wilcoxon test. (D) Box plot of log2 (BASP1 expression) in stage IA (n = 114), stage IB (n = 54), and stage II (n = 58) primary lung tumor samples from the GSE31210 dataset. Student's t-test. (E) Kaplan-Meier survival analyses of lung adenocarcinoma patients with stage I and II disease from GSE31210; patients were divided into two groups (high or low gene expression) using the median level of BASP1 as the cutoff, and survival was analyzed with the log-rank test. (F) IHC analysis of BASP1 in clinical paraffin block specimens of primary lung tumors (n = 40) and brain metastasis tumor specimens (n = 13) of human lung adenocarcinoma from CMUH. The significant difference in IHC staining of BASP1 from the two groups was calculated by Fisher's exact test.

