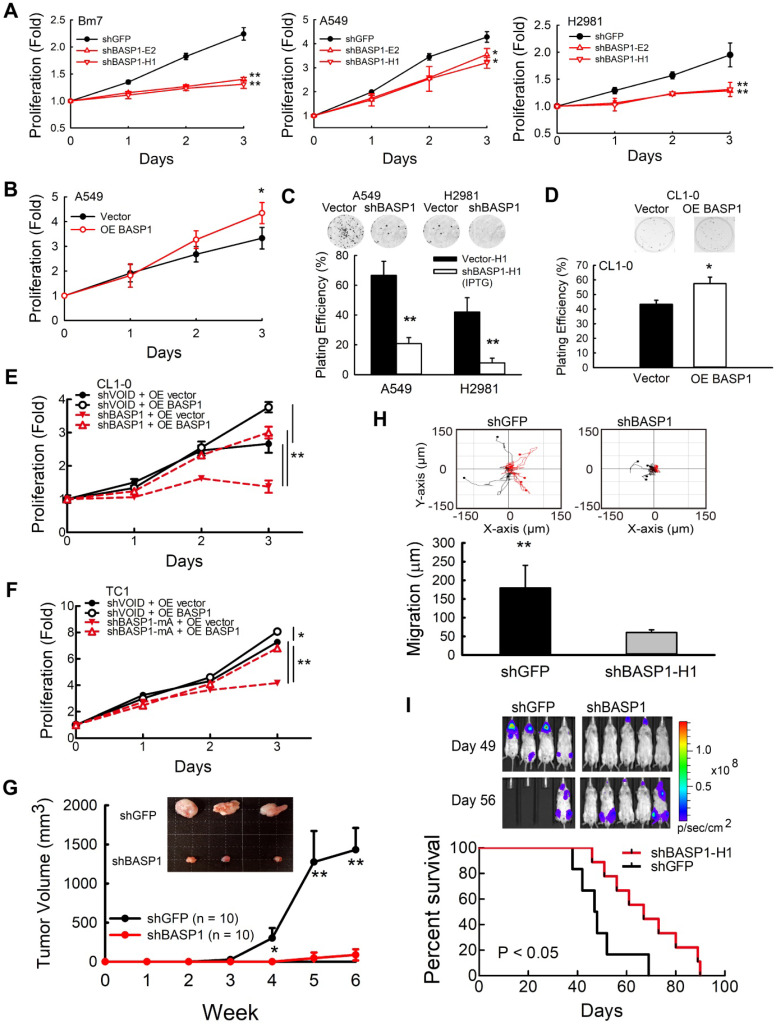
Figure 2.
BASP1 increases lung cancer cell growth and metastasis. (A) The relative proliferation rate of control (shGFP) and BASP1-knockdown cells (shBASP1-E2 and shBASP1-H1) in Bm7 cells, A549 cells, and H2981 lung cancer cells was measured at the indicated time points by MTT assay. (B) Analysis of cell growth of A549 cells transfected with plasmids of BASP1 (OE BASP1) or vector alone. (C) The clonogenicity of BASP1-knockdown lung cancer cells (A549 and H2981) with IPTG-inducible shRNA was indicated by plating efficiency in a colony forming assay. Colonies were visualized by crystal violet staining of the cultures after 14 days. (D) The clonogenicity of CL1-0 lung cancer cells transfected with plasmids of BASP1 or vector alone. (E) Analysis of cell growth of control (shVOID) and BASP1-knockdown CL1-0 cancer cells overexpressing BASP1-GFP or control vector. (F) Analysis of cell growth of control and BASP1-knockdown (shBASP1-mA) TC1 mouse lung cancer cells overexpressing Basp1-GFP. (G) Control and BASP1-knockdown cells were injected subcutaneously into SCID mice (n = 10). Representative tumor images in the control and BASP1-knockdown groups are shown. (H) The migration rates of control and BASP1-knockdown cells were measured by time-lapse video microscopy in each group (top) and quantified (bottom). (I) Luciferase-expressing control or BASP1-knockdown cells were intracardially injected into SCID mice (n = 10 for each group). Representative images by IVIS from days 49 and 56 post injection are shown (left). The mouse survival time was monitored for 90 days. Survival was analyzed with the Kaplan-Meier method.

