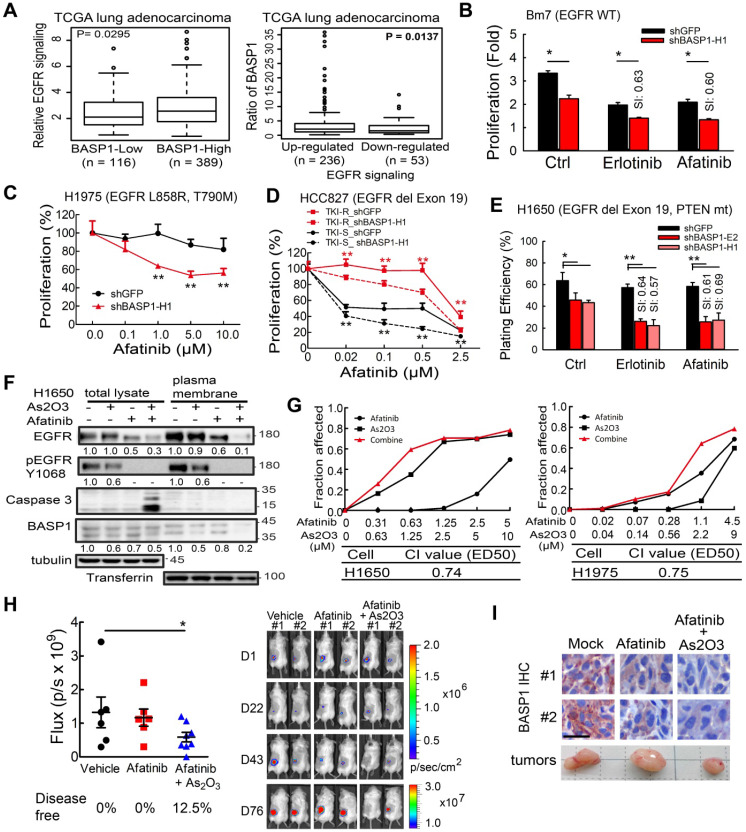
Figure 6.
The effects of BASP1 reduction in lung cancer cells treated with EGFR inhibitors. (A) Relative EGFR signaling in the TCGA lung adenocarcinoma dataset classified by BASP1 expression. BASP1-low and BASP1-high, BASP1 expression in tumors was lower or higher than that in normal tissues, respectively (left). The relative expression of BASP1 in the TCGA lung adenocarcinoma dataset with upregulated or downregulated EGFR signaling gene signatures (right). P values, Welch's t-test. (B) Cell proliferation of Bm7 cells treated with TKI by MTT assay. SI, sensitization index. Erlotinib, 20 µM. Afatinib, 10 µM. (C) Cell proliferation of H1975 cells treated with afatinib for 3 days by MTT assay. (D) Cell proliferation of TKI-sensitive (TKI-S) HCC827 and TKI-resistant (TKI-R) HCC827-GR8 cells treated with afatinib. Cells were transiently transfected with shRNA against BASP1 and then treated with different concentrations of EGFR TKIs for 3 days. IC50 of shGFP and shBASP1 in TKI-R cells: 2.12 and 0.82 μM; IC50 of shGFP and shBASP1 in TKI-S cells: 0.063 and 0.005 µM. (E) Plating efficiency of H1650 lung cancer cells treated with EGFR TKIs by colony formation assay. Erlotinib, 5 µM. Afatinib, 1 µM. (F) Western blot analysis of indicated proteins from H1650 lung cancer cells treated with As2O3 and afatinib for 24 hours. (G) Synergistic therapeutic effects of As2O3 and afatinib in H1650 and H1975 cells by MTT assay. Combination index (CI) analysis (bottom). (H) Comparison of bioluminescence signals of tumors from SCID mice bearing subcutaneous H1975 lung cancer cells treated with afatinib and As2O3 on day 76. Vehicle (N=6); afatinib (N=6); afatinib + As2O3 (N=8). Representative images of tumor signals from the IVIS system (right). (I) IHC analysis of BASP1 in H1975 lung tumors from mice models. Two individual tumors. Scale bar, 25 µm.

