Figure 4.
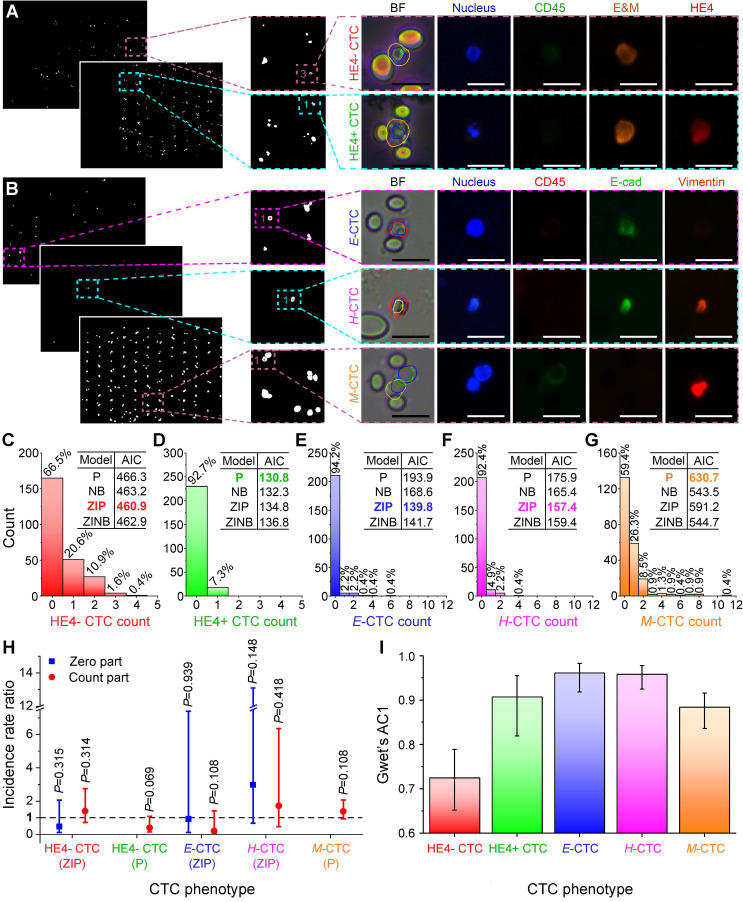
Benchmarking ALICE CTC phenotypic count against human enumeration in real fluorescent images. Identification, localization and enumeration of CTC phenotypes: (A) HE4- (DAPI+/CD45-/E&M+/HE4-) and HE4+ (DAPI+/CD45-/E&M+/HE4+) CTCs from 61 ovarian cancer patients, (B) E CTCs (DAPI+/CD45-/E-cadherin+/vimentin-), H CTCs (DAPI+/CD45-/E-cadherin+/vimentin+) and M CTCs (DAPI+/CD45-/E-cadherin-/vimentin+) from 46 pancreatic cancer patients. E&M denotes combined epithelial and mesenchymal markers. Scale bar: 20 µm. (C-G) Distribution of the phenotypic count for HE4- CTC, HE4+ CTC, E-CTC, H-CTC and M-CTC. Inset tables show the AIC values for the 4 fitted regression models: Poisson (P), negative binomial (NB), zero-inflated Poisson (ZIP) and zero-inflated negative binomial (ZINB) model and the model with the lowest AIC value is bolded and colored. (H) Incidence rate ratio (IRR) plot indicating the CTC phenotypic counts of ALICE and human are statistically indifferent. The fitted regression models are listed for each CTC phenotypes and the zero-inflated models have a zero part and a count part whereas nonzero-inflated models only have a count part. The dash line represents IRR=1 and error bars denote the 95% CI of the IRR. (I) Agreement analysis between ALICE and human counts using Gwet's AC1 for the 5 CTC phenotypes. Error bars represent the 95% CI.

