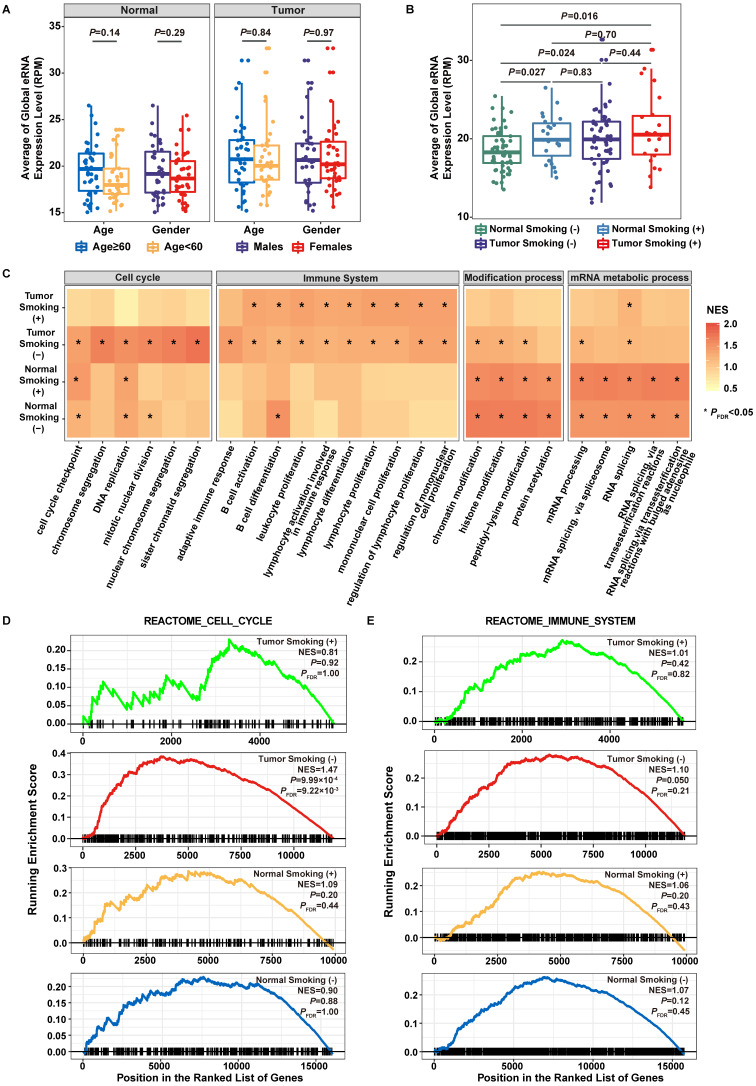
Figure 2.
Functional evaluation of transcribed eRNAs. A. Association of eRNA expression with age and gender. B. Association of eRNA expression with smoking statuses. C. Normalized enrichment scores (NES) of the top 20 pathways in lung adenocarcinoma smokers, lung adenocarcinoma non-smokers, adjacent normal smokers, and adjacent normal non-smokers. Color of the bar indicates the normalized enrichment score. Statistical significance levels are depicted by *PFDR < 0.05, **PFDR < 0.01. D. Gene Set Enrichment Analysis (GSEA) plot depicts the enrichment of co-expressed protein-coding genes (PCGs) of eRNAs in the Cell Cycle gene set from Reactome pathway dataset. E. GSEA plot depicts the enrichment of co-expressed PCGs of eRNAs in the Immune System gene set from Reactome pathway dataset.

