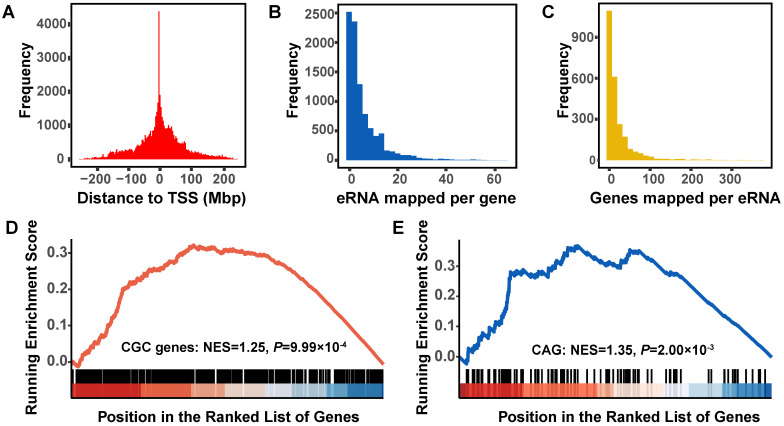
Figure 3.
In silico prediction of functional eRNAs for lung adenocarcinoma. A. Distribution of the distance of each eRNA to the transcriptional start site (TSS) of the co-expressed protein-coding genes (PCGs). B. Distribution of the number of PCGs co-expressed with per eRNA. C. Distribution of the number of eRNAs co-expressed with per PCG. D. Gene Set Enrichment Analysis (GSEA) plot depicts the enrichment of co-expressed PCGs of eRNAs in Cancer Gene Census (CGC) driver genes. E. GSEA plot depicts the enrichment of co-expressed PCGs of eRNAs in clinical actionable genes (CAGs).

