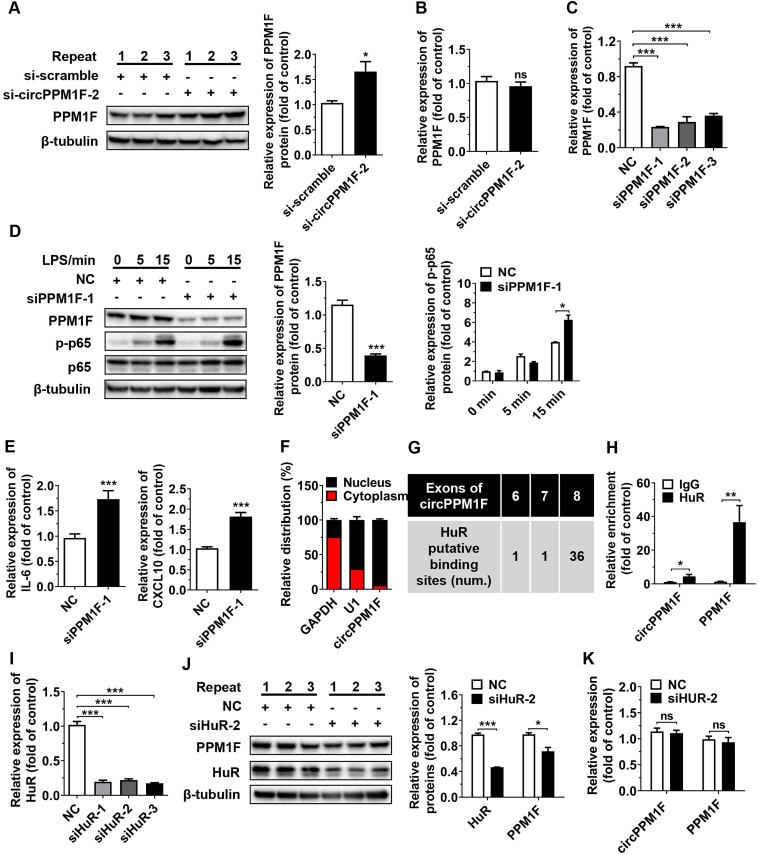
Figure 3.
circPPM1F competitively binds to HuR to impair PPM1F translation. A. Western blotting analysis to evaluate levels of PPM1F in circPPM1F knocked down-THP1 macrophages. B. qRT-PCR analyses of PPM1F expression in THP1 macrophages with circPPM1F knockdown. C. Analysis of PPM1F expression in THP1 macrophages transfected with PPM1F siRNA (200 nM) or control siRNA by qRT-PCR. D. Western blot analysis of PPM1F, p65, and p-p65 in THP1 macrophages with PPM1F knockdown, followed by LPS stimulation. E. Quantitative real-time PCR (qRT-PCR) analysis of M1-associated gene expression in THP1 macrophages with PPM1F knockdown, followed by LPS stimulation. F. qRT-PCR results showing the distribution of circPPM1F in the cytoplasmic and nuclear fractions of THP1 macrophages. GAPDH as cytoplasm control transcript, and U1 as nuclear control transcript. G. Putative HuR binding sites within circPPM1F full-length sequence. H. The enrichment levels of circPPM1F and PPM1F in the products of the RNA immunoprecipitation (RIP) assay (HuR IP compared with IgG IP) as detected by qRT-PCR. I. qRT-PCR analysis of HuR in THP1 macrophages transfected with HuR siRNA (200 nM) or control siRNA. J. Protein levels of PPM1F and HuR were detected by western blotting in THP1 macrophages with HuR knockdown. K. qRT-PCR analysis of circPPM1F and PPM1F in THP1 macrophages with HuR knockdown. The levels of PPM1F, p-p65 and HuR were normalized to those of β-tubulin and quantified using Image J software. Data are presented as mean ± SEM from three independent experiments. *p ≤ 0.05, **p ≤ 0.01, ***p ≤ 0.001, ns indicates no significance.

