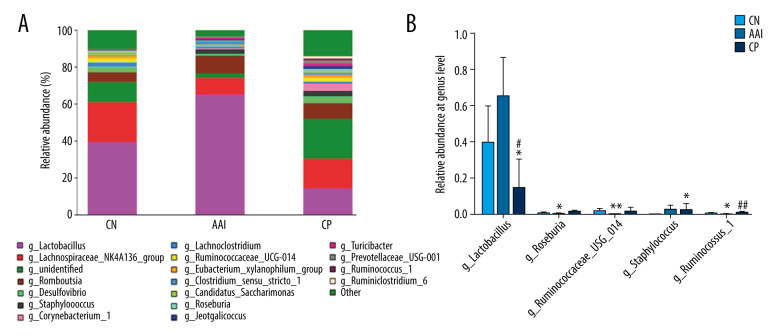
Figure 10.
Relative abundance comparison of major genera of gut microbiota among groups. (A) Bacterial composition and relative abundances at the genus level among groups. (B) Relative abundance comparison of major genera among groups. * P<0.05, ** P<0.01 vs. CN group; # P<0.05, ## P <0.01 vs. AAI group.

