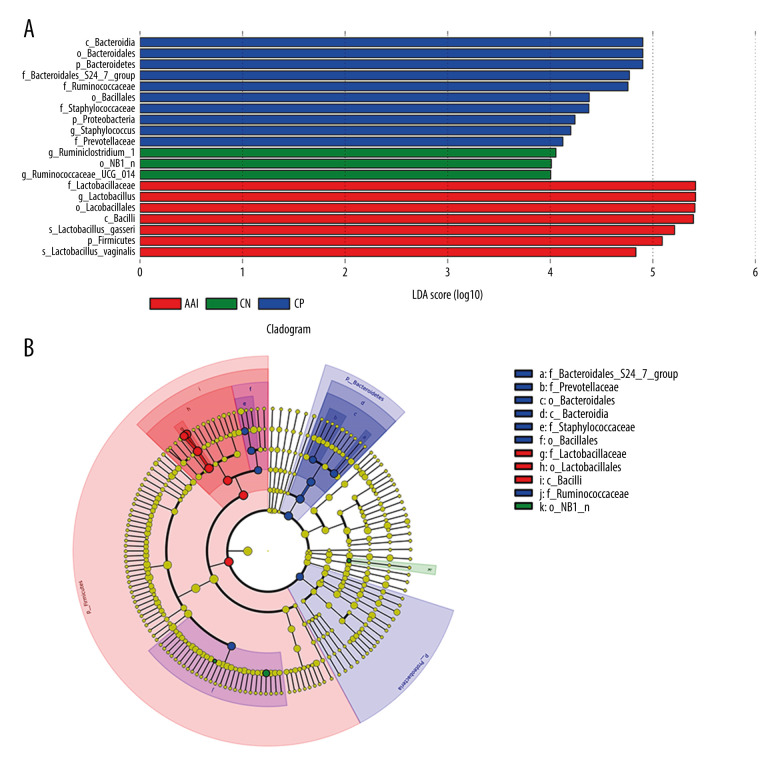
Figure 7.
LEfSe based on 16 S rRNA gene sequences. (A) Histogram of the LDA scores demonstrates differentially abundant bacterial taxa among 3 groups (P<0.05, LDA score >2.0). (B) Cladogram shows the taxonomic distribution of differentially abundant bacterial taxa from phylum to family among 3 groups.

