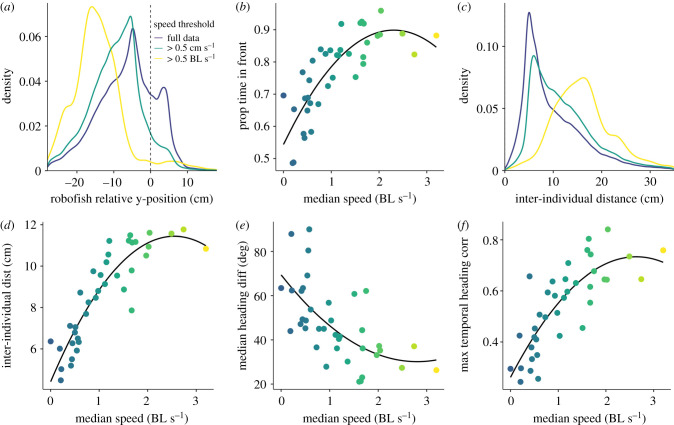
Figure 2.
(a,c) Density plot of robofish's relative y-position and distance to its live partner, and (b,d,e,f) scatterplots of fish's median speed in relation to the leadership, cohesion, alignment and temporal coordination of the pair. Plots a and c show both the full data (blue line), the data was subsetted to where the focal fish moved at >0.5 cm/s (green line), and at >0.5 BL/s (yellow line). Colour scale indicates speed (blue = low; yellow = high) and solid lines show the polynomial functions fitted in our models.

